

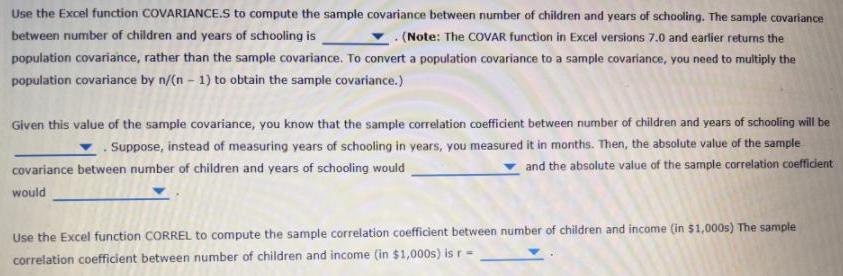
Use the Excel function COVARIANCE.S to compute the sample covariance between number of children and years...
Fantastic news! We've Found the answer you've been seeking!
Question:
Transcribed Image Text:
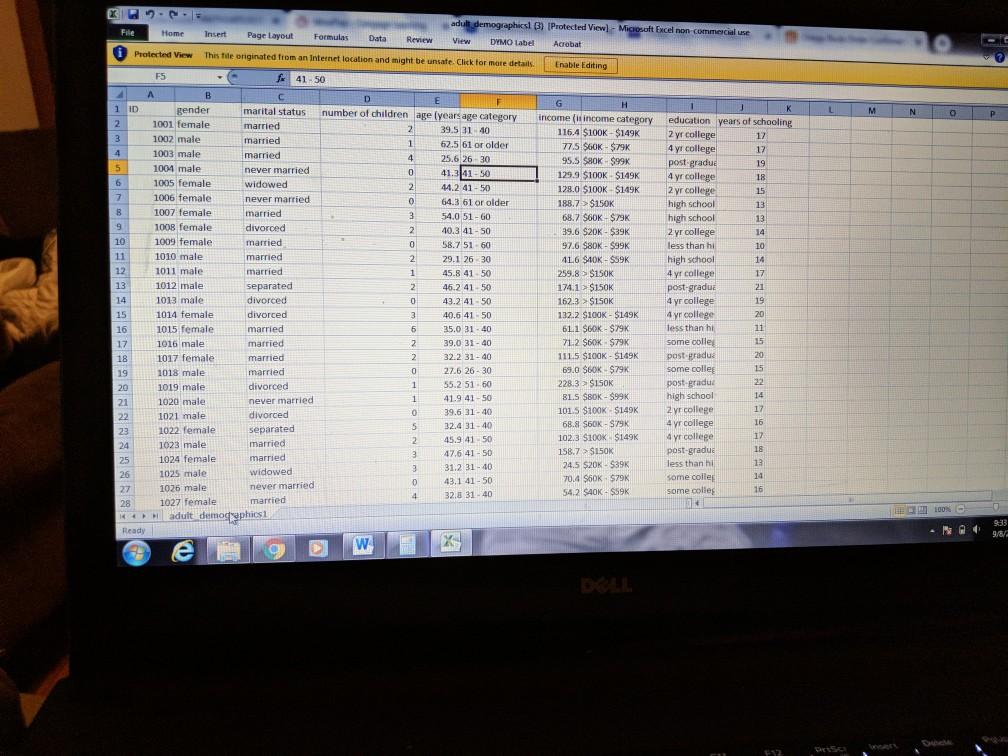
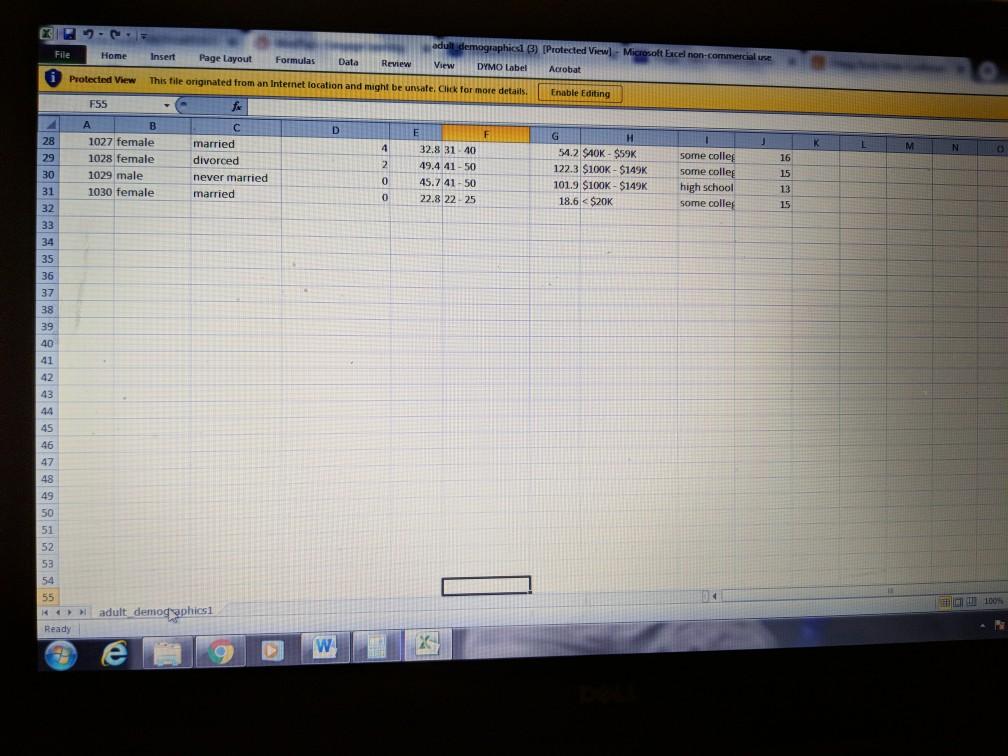
Use the Excel function COVARIANCE.S to compute the sample covariance between number of children and years of schooling. The sample covariance between number of children and years of schooling is . (Note: The COVAR function in Excel versions 7.0 and earlier returns the population covariance, rather than the sample covariance. To convert a population covariance to a sample covariance, you need to multiply the population covariance by n/(n-1) to obtain the sample covariance.) Given this value of the sample covariance, you know that the sample correlation coefficient between number of children and years of schooling will be Suppose, instead of measuring years of schooling in years, you measured it in months. Then, the absolute value of the sample covariance between number of children and years of schooling would and the absolute value of the sample correlation coefficient would Use the Excel function CORREL to compute the sample correlation coefficient between number of children and income (in $1,000s) The sample correlation coefficient between number of children and income (in $1,000s) is r X 75 2 File Home i Protected View F5 1 ID 2 3 4 5 6 7 8 9 10 11 12 13 14 15 16 17 18 19 20 21 22 23 24 25 26 27 28 144 A adult demographicsl (3) [Protected View)- Microsoft Excel non-commercial use Insert Page Layout Formulas Data Review View DYMO Label Acrobat This file originated from an Internet location and might be unsafe. Click for more details. Enable Editing f 41-50 C D E F B gender G 1 K number of children age (years age category marital status married 1001 female 2 39.5 31-40 education years of schooling 2 yr college 1002 male married 1 62.5 61 or older 1003 male married 4 H income (income category 116.4 $100K $149K 77.5 $60K $79K 95.5 $80K-$99K 129.9 $100K $149K 128.0 $100K $149K 188.7>$150K 25.6 26-30 1004 male 41.341-50 never married. widowed 1005 female 1006 female 44.2 41-50 64.3 61 or older 54.0 51-60 never married married divorced 1007 female 17 17 19 18. 15 13 13 14 10 14 17 21 4 yr college post-gradua 4 yr college 2 yr college high school high school 2 yr college less than hi high school 4 yr college post-gradua 1008 female 1009 female married. 1010 male. 40.3 41-50 58.7 51-60 29.1 26-30 45.8 41-50 46.2 41 50 1011 male 1012 male 68.7 $60K-$79K 39.6 $20K - $39K 97.6 $80K-$99K 416 $40K-$59K 259.8 $150K 174.1>$150K 162.3>$150K 132.2 $100K-$149K 61.1 $60K $79K 71.2 $60K $79K 111.5 $100K $149K 1013 male 43.2 41 50 4 yr college married married separated divorced divorced married married married 19 1014 female. 40.6 41 50 1015 female 35.0 31-40 1016 male 39.0 31-40 1017 female 32.2 31-40 4 yr college less than hi some colle post-gradua some colleg post-gradua high school 27.6 26-30 1018 male, 69.0 $60K $79K 228.3 $150K 55.2 51-60 1019 male. 41.9 41-50 1020 male married divorced never married divorced separated married 2 yr college 1021 male 39.6 31-40 32.4 31-40 1022 female 45.9 41-50 1023 male 81.5 $80K-$99K 101.5 $100K $149K 68.8 $60K-$79K 102.3 $100K $149K 158.7>$150K 24.5 $20K $39K 70.4 $60K $79K 54.2 $40K-$59K 47.6 41-50 1024 female married widowed 31.2 31-40 4 yr college 4 yr college post-gradua less than hi some colle some colleg * 1025 male 43.1 41-50 1026 male never married married 32.8 31-407 1027 female adult demographics1 X Ready W 0 2 0 3 2 0 2 1 2 0 3 6 2 2 0 1 1 10 5 2 3 3 0 4 20 11 15 20 15 22 14 17 16 17 18 13 14 16 $12 L prisc M N O 100% - - 14 CHEM P 9:33 9/8/2 RESICI adult demographics] (3) DYMO Label File Home Insert Page Layout [Protected View) Microsoft Excel non-commercial use Acrobat Formulas Data Review View i Protected View This file originated from an Internet location and might be unsafe. Click for more details. Enable Editing F55 fix с A B D E F G H J 28 1027 female 4 32.8 31-40 married divorced 29 1028 female 1 some colleg some colleg high school 2 54.2 $40K-$59K 122.3 $100K-$149K 101.9 $100K-$149K 18.6 <$20K 49.4 41-50 30 1029 male never married 0 45.7 41-50 22.8 22-25 31 1030 female married. 0 some colle 32 33 34 35 36 37 38 39 40 41 42 43 44 45 46 47 48 49 50 51 52 53 54 55 Ready adult demographics1 e W 204 1 16 15 13 15 K L M N C 100% M Use the Excel function COVARIANCE.S to compute the sample covariance between number of children and years of schooling. The sample covariance between number of children and years of schooling is . (Note: The COVAR function in Excel versions 7.0 and earlier returns the population covariance, rather than the sample covariance. To convert a population covariance to a sample covariance, you need to multiply the population covariance by n/(n-1) to obtain the sample covariance.) Given this value of the sample covariance, you know that the sample correlation coefficient between number of children and years of schooling will be Suppose, instead of measuring years of schooling in years, you measured it in months. Then, the absolute value of the sample covariance between number of children and years of schooling would and the absolute value of the sample correlation coefficient would Use the Excel function CORREL to compute the sample correlation coefficient between number of children and income (in $1,000s) The sample correlation coefficient between number of children and income (in $1,000s) is r X 75 2 File Home i Protected View F5 1 ID 2 3 4 5 6 7 8 9 10 11 12 13 14 15 16 17 18 19 20 21 22 23 24 25 26 27 28 144 A adult demographicsl (3) [Protected View)- Microsoft Excel non-commercial use Insert Page Layout Formulas Data Review View DYMO Label Acrobat This file originated from an Internet location and might be unsafe. Click for more details. Enable Editing f 41-50 C D E F B gender G 1 K number of children age (years age category marital status married 1001 female 2 39.5 31-40 education years of schooling 2 yr college 1002 male married 1 62.5 61 or older 1003 male married 4 H income (income category 116.4 $100K $149K 77.5 $60K $79K 95.5 $80K-$99K 129.9 $100K $149K 128.0 $100K $149K 188.7>$150K 25.6 26-30 1004 male 41.341-50 never married. widowed 1005 female 1006 female 44.2 41-50 64.3 61 or older 54.0 51-60 never married married divorced 1007 female 17 17 19 18. 15 13 13 14 10 14 17 21 4 yr college post-gradua 4 yr college 2 yr college high school high school 2 yr college less than hi high school 4 yr college post-gradua 1008 female 1009 female married. 1010 male. 40.3 41-50 58.7 51-60 29.1 26-30 45.8 41-50 46.2 41 50 1011 male 1012 male 68.7 $60K-$79K 39.6 $20K - $39K 97.6 $80K-$99K 416 $40K-$59K 259.8 $150K 174.1>$150K 162.3>$150K 132.2 $100K-$149K 61.1 $60K $79K 71.2 $60K $79K 111.5 $100K $149K 1013 male 43.2 41 50 4 yr college married married separated divorced divorced married married married 19 1014 female. 40.6 41 50 1015 female 35.0 31-40 1016 male 39.0 31-40 1017 female 32.2 31-40 4 yr college less than hi some colle post-gradua some colleg post-gradua high school 27.6 26-30 1018 male, 69.0 $60K $79K 228.3 $150K 55.2 51-60 1019 male. 41.9 41-50 1020 male married divorced never married divorced separated married 2 yr college 1021 male 39.6 31-40 32.4 31-40 1022 female 45.9 41-50 1023 male 81.5 $80K-$99K 101.5 $100K $149K 68.8 $60K-$79K 102.3 $100K $149K 158.7>$150K 24.5 $20K $39K 70.4 $60K $79K 54.2 $40K-$59K 47.6 41-50 1024 female married widowed 31.2 31-40 4 yr college 4 yr college post-gradua less than hi some colle some colleg * 1025 male 43.1 41-50 1026 male never married married 32.8 31-407 1027 female adult demographics1 X Ready W 0 2 0 3 2 0 2 1 2 0 3 6 2 2 0 1 1 10 5 2 3 3 0 4 20 11 15 20 15 22 14 17 16 17 18 13 14 16 $12 L prisc M N O 100% - - 14 CHEM P 9:33 9/8/2 RESICI adult demographics] (3) DYMO Label File Home Insert Page Layout [Protected View) Microsoft Excel non-commercial use Acrobat Formulas Data Review View i Protected View This file originated from an Internet location and might be unsafe. Click for more details. Enable Editing F55 fix с A B D E F G H J 28 1027 female 4 32.8 31-40 married divorced 29 1028 female 1 some colleg some colleg high school 2 54.2 $40K-$59K 122.3 $100K-$149K 101.9 $100K-$149K 18.6 <$20K 49.4 41-50 30 1029 male never married 0 45.7 41-50 22.8 22-25 31 1030 female married. 0 some colle 32 33 34 35 36 37 38 39 40 41 42 43 44 45 46 47 48 49 50 51 52 53 54 55 Ready adult demographics1 e W 204 1 16 15 13 15 K L M N C 100% M
Expert Answer:
Answer rating: 100% (QA)
EB Copy Paste Clipboard F2 A 1 ID 2 3 4 5 LO 6 7 8 9 10 12 13 14 15 C 17 18 19 20 21 22 23 Ready Cal... View the full answer

Related Book For 

Posted Date:
Students also viewed these accounting questions
-
Suppose that you have bivariate data for a sample of a population. a. How would you decide whether an association exists between the two variables under consideration? b. Assuming that you make no...
-
Use the following data to answer the questions that follow. Company Beta Savoy Corp..0.70 Hokie Industries .1.35 Graham Records .2.05 Expo Enterprises .0.45 S&P 500 .1.00 a. If the S&P 500 goes up by...
-
Use the accompanying graph to answer the questions that follow. a. Suppose this monopolist is unregulated.(1) What price will the firm charge to maximize its profits?(2) What is the level of consumer...
-
Ames Manufacturing Plant produces two different replacement parts for dishwashers. During a normal shift, they have 7 hours of time available on their main fabrication machine. The machine will...
-
a. Using table 12.9 as a reference, find and explain the differences between the results for Staphylococcus and Pseudomonas. Are any of these drugs broad spectrums? b. Explain the difference in the...
-
When benzene (C6H6) reacts with bromine (Br2), bromobenzene (C6H5Br) is obtained: C6H6 + Br2 C6H5Br + HBr (a) When 30.0 g of benzene reacts with 65.0 g of bromine, what is the theoretical yield of...
-
Football and Brain Size Exercise 2.143 on page 102 introduces a study that examines several variables on collegiate football players, including the variable Years, which is number of years playing...
-
Rosenberg Land Development (RLD) is a developer of condominium properties in the Southwest United States. RLD has recently acquired a 40.625 acre site outside of Phoenix, Arizona. Zoning restrictions...
-
Almost all routers use TCAM to speed up table lookup. Due to the need of performing maximum sequencing matching, we need to organize the prefix entries in the lookup table according to their lengths...
-
The proposed rates were not in the range the CEO expected given the pricing analysis. The CEO has asked the pricing actuary to verify the total projected loss cost excluding potential large storm...
-
Use graphical methods to solve the following linear programming problem. Minimize : z = 2x + 3y Subject to: x + y = 6 x >= 0, y >= 0 The minimum value of z is at the corner point
-
What are types of business disasters and why is disaster recovery important. In your example: What business disaster occurred? What was the impact of the business disaster? Did the company have a...
-
When an injured worker in the Australian Capital Territory is returning to work what are their roles and responsibilities, duties and rights? what are the roles, duties, responsibilities and rights...
-
Describe the advantages and disadvantages of the following ways of describing functional requirements. Give examples of when each is used . please use simple words a. brand b. by specification of...
-
How does a company choose a CSR project when there are many options and needs? What type of project can help a company's business and marketing objectives? How should a business handle a project?...
-
Describing a Process Given two similar triangles, what would you need to know to find an unknown length? How would you find that unknown length?
-
B14-B15) In a tender bidding process, the technical score to financial score ratio is 25:75. There is only one competitor in this bidding. i.e. Total score = 25% of technical score + 75% financial...
-
Imagine a sound wave with a frequency of 1.10 kHz propagating with a speed of 330 m/s. Determine the phase difference in radians between any two points on the wave separated by 10.0 cm.
-
One recommendation in the chapter is that companies with promising investment opportunities should strive to maintain a conservative capital structure. Yet many promising small businesses are heavily...
-
Financial data for Industrial Inc follows: ($ in thousands) a. Calculate the current and quick ratio at the end of each year. How has the company's short-term liquidity changed over this period? b....
-
Table shows the December 31, 2012, pro forma balance sheet and income statements for R&E Supplies, Inc. The pro forma balance sheet shows that R&E Supplies will need external funding from the bank of...
-
Make a bar chart of \(\mathrm{CO}_{2}\) footprint divided by embodied energy, using data from the data sheets of Appendix A, Table A10, for a. Cement b. Low carbon steel c. Copper d....
-
a. Window frames are made from extruded aluminium. It is argued that making them instead from extruded PVC would give a product with a lower embodied energy and carbon footprint. If the section shape...
-
a. A range of office furniture includes a chunky hardwood table weighing \(18 \mathrm{~kg}\) and a much lighter table with a \(3.0 \mathrm{~kg}\) virgin aluminium frame and a \(3.0 \mathrm{~kg}\)...

Study smarter with the SolutionInn App