

Question: To be done in Python 1. The data in HW08data.txt represent measured distances in in. and forces in lbf when stretching a spring. The file
To be done in Python
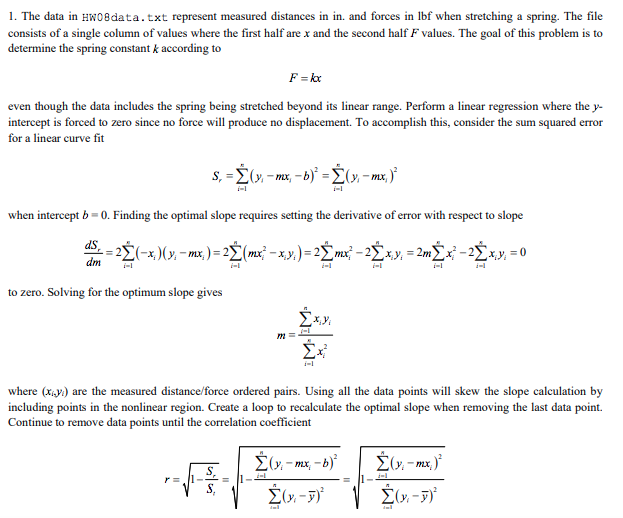
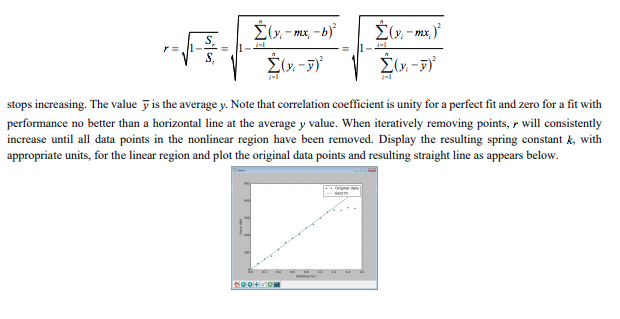
1. The data in HW08data.txt represent measured distances in in. and forces in lbf when stretching a spring. The file consists of a single column of values where the first half are x and the second half F values. The goal of this problem is to determine the spring constant k according to even though the data includes the spring being stretched beyond its linear range. Perform a linear regression where the y- intercept is forced to zero since no force will produce no displacement. To accomplish this, consider the sum squared error for a linear curve fit i-1 when intercept b-0. Finding the optimal slope requires setting the derivative of error with respect to slope dml to zero. Solving for the optimum slope gives where (xy) are the measured distance force ordered pairs. Using all the data points will skew the slope calculation by including points in the nonlinear region. Create a loop to recalculate the optimal slope when removing the last data point. Continue to remove data points until the correlation coefficient mx S, 1. The data in HW08data.txt represent measured distances in in. and forces in lbf when stretching a spring. The file consists of a single column of values where the first half are x and the second half F values. The goal of this problem is to determine the spring constant k according to even though the data includes the spring being stretched beyond its linear range. Perform a linear regression where the y- intercept is forced to zero since no force will produce no displacement. To accomplish this, consider the sum squared error for a linear curve fit i-1 when intercept b-0. Finding the optimal slope requires setting the derivative of error with respect to slope dml to zero. Solving for the optimum slope gives where (xy) are the measured distance force ordered pairs. Using all the data points will skew the slope calculation by including points in the nonlinear region. Create a loop to recalculate the optimal slope when removing the last data point. Continue to remove data points until the correlation coefficient mx S
Step by Step Solution
There are 3 Steps involved in it

Get step-by-step solutions from verified subject matter experts