

Question: To begin DRAWING your Network (for PERT 1): Draw a POINT on the left of your paper: Look at 2nd Column DASHES do you
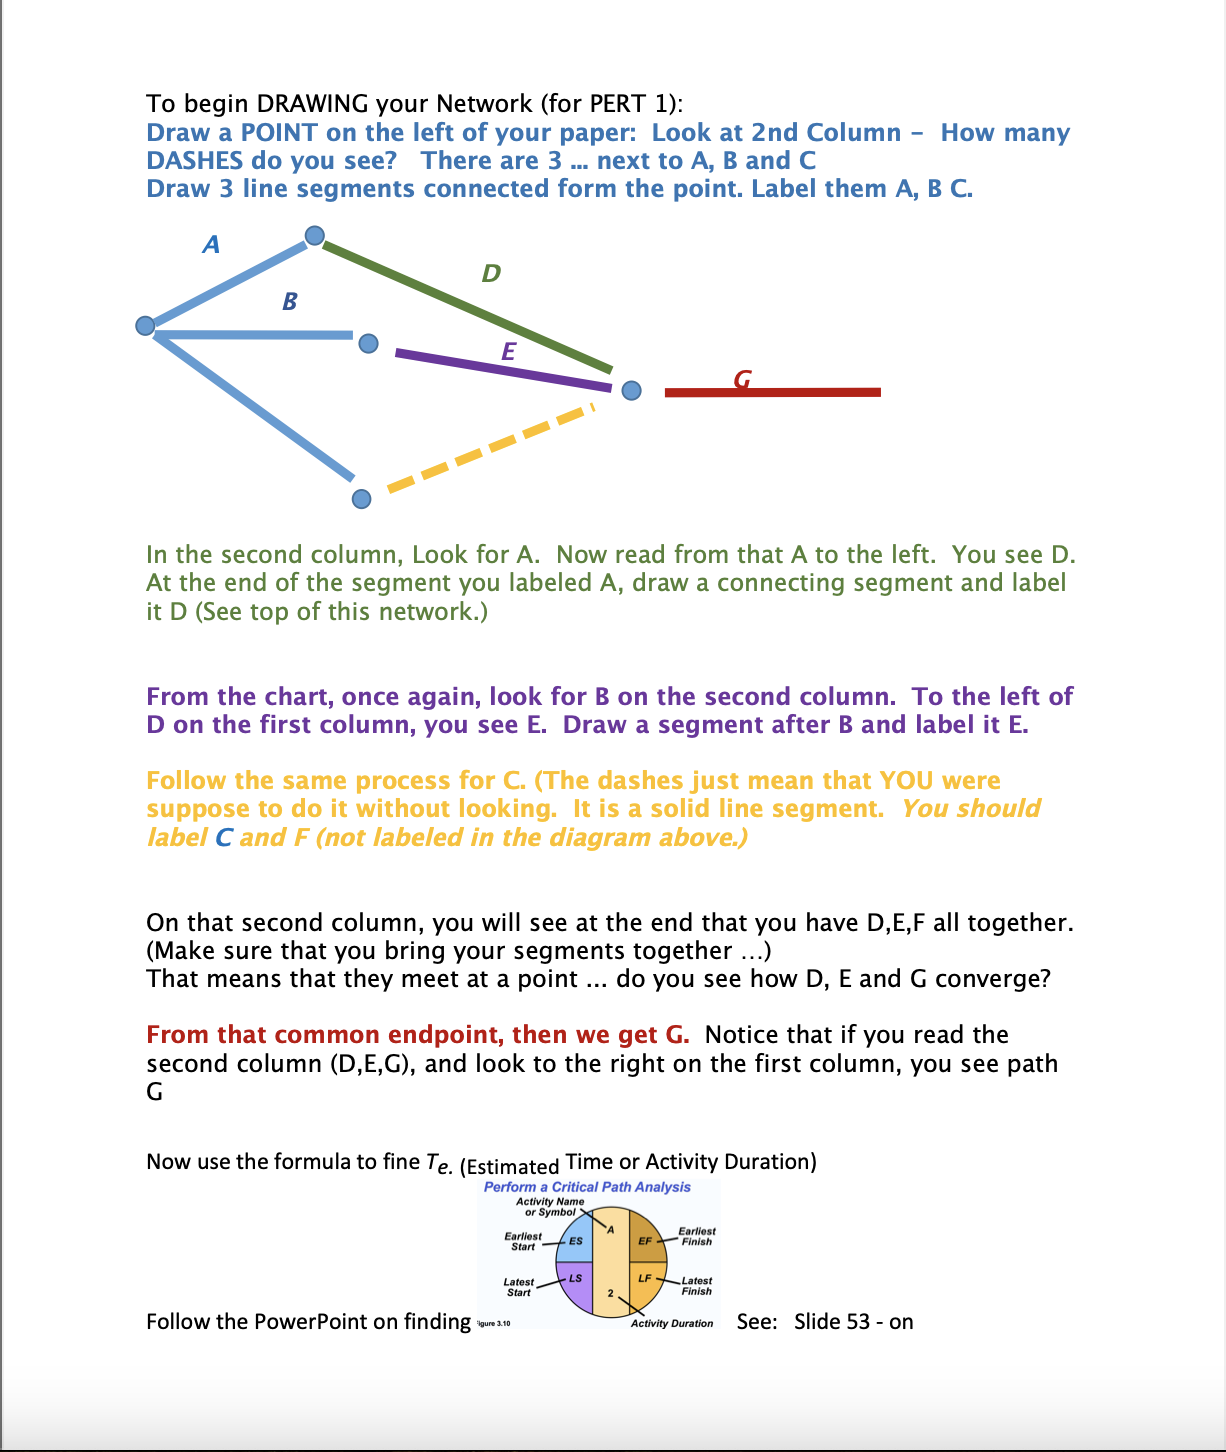
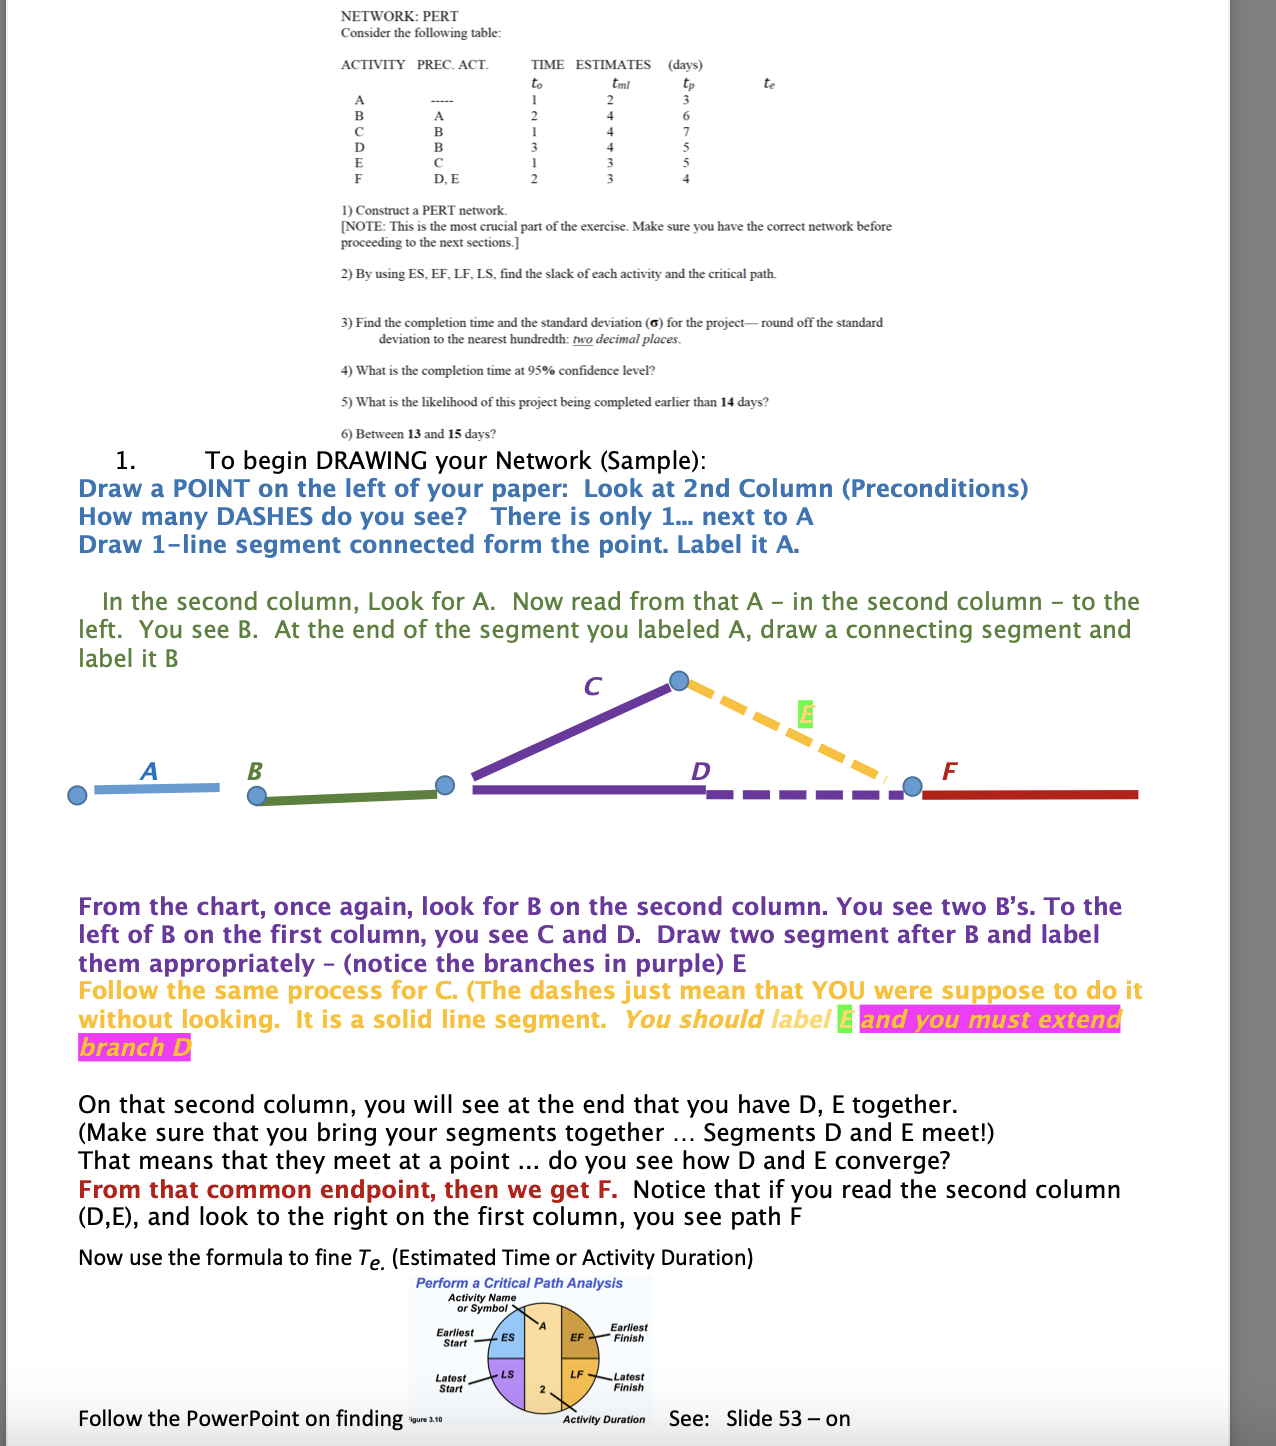
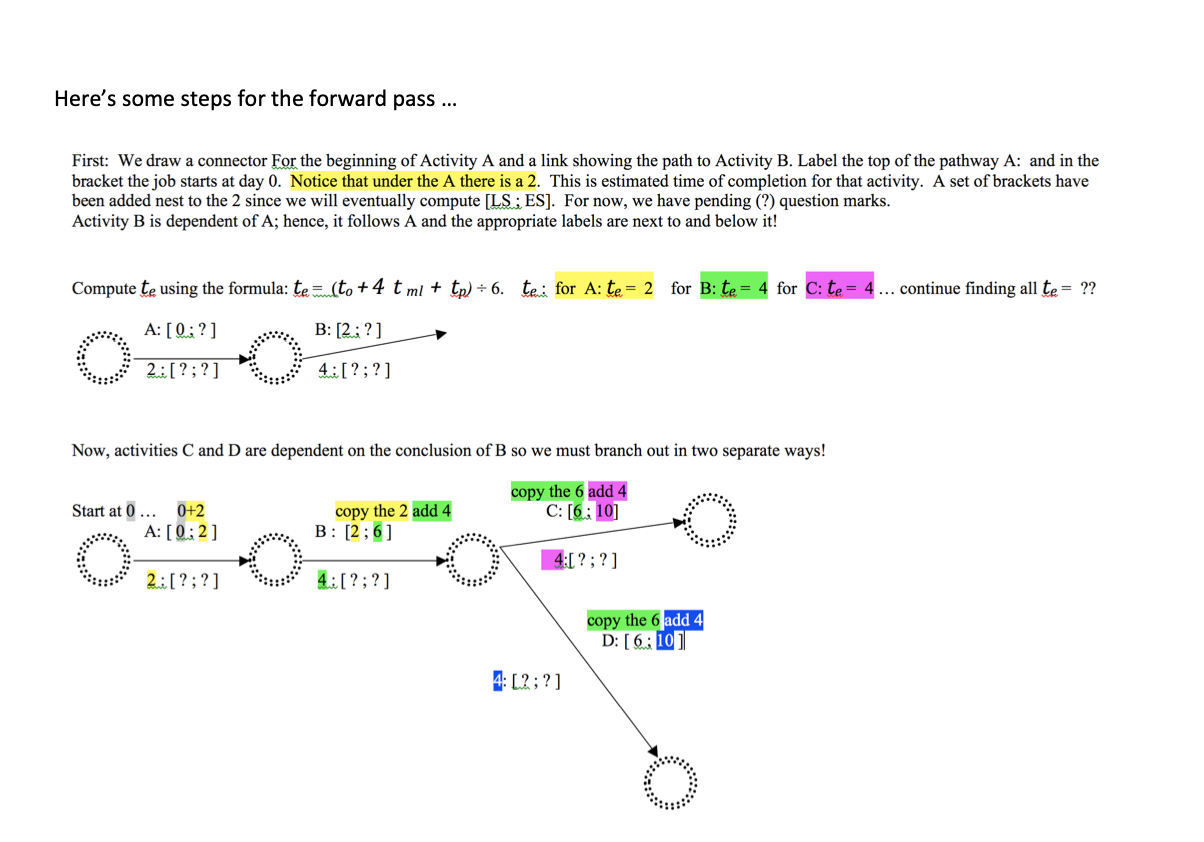
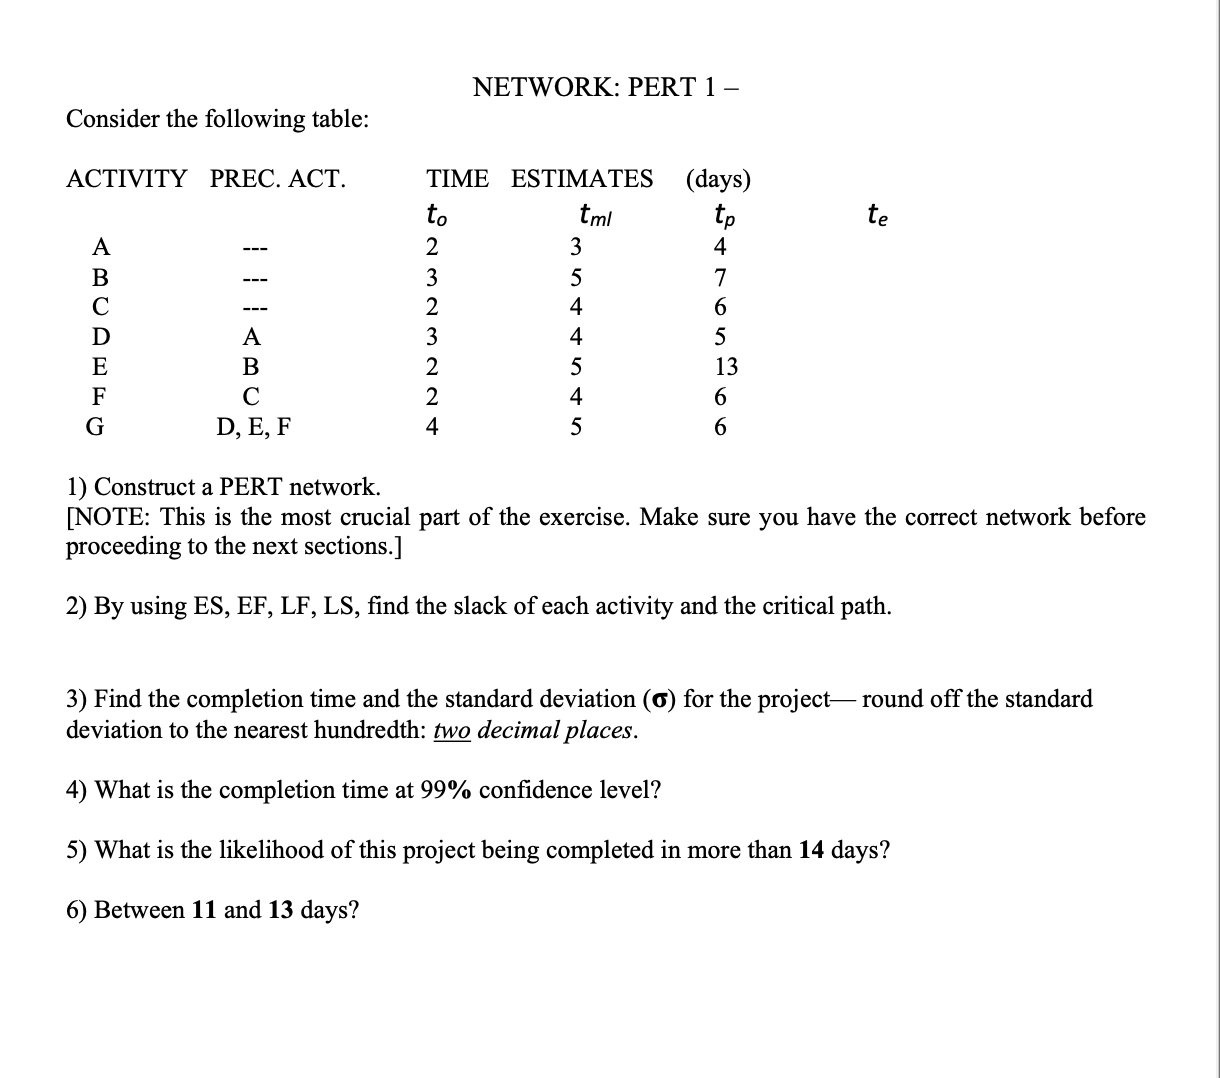
To begin DRAWING your Network (for PERT 1): Draw a POINT on the left of your paper: Look at 2nd Column DASHES do you see? There are 3. ... next to A, B and C Draw 3 line segments connected form the point. Label them A, B C. A B D E In the second column, Look for A. Now read from that A to the left. You see D. At the end of the segment you labeled A, draw a connecting segment and label it D (See top of this network.) From the chart, once again, look for B on the second column. To the left of D on the first column, you see E. Draw a segment after B and label it E. Follow the same process for C. (The dashes just mean that YOU were suppose to do it without looking. It is a solid line segment. You should label C and F (not labeled in the diagram above.) Follow the PowerPoint on finding On that second column, you will see at the end that you have D,E,F all together. (Make sure that you bring your segments together ...) That means that they meet at a point ... do you see how D, E and G converge? From that common endpoint, then we get G. Notice that if you read the second column (D,E,G), and look to the right on the first column, you see path G Now use the formula to fine Te. (Estimated Time or Activity Duration) Perform a Critical Path Analysis Activity Name or Symbol X Earliest ES Start Latest Start Figure 3.10 LS G 'A EF LF How many Earliest Finish Latest Finish Activity Duration See: Slide 53 - on NETWORK: PERT Consider the following table: ACTIVITY PREC. ACT. A A B B D E F A B B C D, E 3) Find the completion time and the standard deviation (G) for the project-round off the standard deviation to the nearest hundredth: two decimal places. 4) What is the completion time at 95% confidence level? 5) What is the likelihood of this project being completed earlier than 14 days? 6) Between 13 and 15 days? 1. To begin DRAWING your Network (Sample): Draw a POINT on the left of your paper: Look at 2nd Column (Preconditions) How many DASHES do you see? There is only 1... next to A Draw 1-line segment connected form the point. Label it A. 1) Construct a PERT network. [NOTE: This is the most crucial part of the exercise. Make sure you have the correct network before proceeding to the next sections.] 2) By using ES, EF, LF, LS, find the slack of each activity and the critical path. In the second column, Look for A. Now read from that A - in the second column - to the left. You see B. At the end of the segment you labeled A, draw a connecting segment and label it B C TIME ESTIMATES to tml 2 Follow the PowerPoint on finding From the chart, once again, look for B on the second column. You see two B's. To the left of B on the first column, you see C and D. Draw two segment after B and label them appropriately - (notice the branches in purple) E Follow the same process for C. (The dashes just mean that YOU were suppose to do it without looking. It is a solid line segment. You should label and you must extend branch D Earliest Start On that second column, you will see at the end that you have D, E together. (Make sure that you bring your segments together ... Segments D and E meet!) That means that they meet at a point ... do you see how D and E converge? Now use the formula to fine Te. (Estimated Time or Activity Duration) Perform a Critical Path Analysis Activity Name or Symbol Latest Start From that common endpoint, then we get F. Notice that if you read the second column (D,E), and look to the right on the first column, you see path F Figure 3.10 ES (days) tp 3 -LS 2 te EF D Earliest Finish LF Latest Finish Activity Duration F See: Slide 53 - on Here's some steps for the forward pass ... First: We draw a connector For the beginning of Activity A and a link showing the path to Activity B. Label the top of the pathway A: and in the bracket the job starts at day 0. Notice that under the A there is a 2. This is estimated time of completion for that activity. A set of brackets have been added nest to the 2 since we will eventually compute [LS; ES]. For now, we have pending (?) question marks. Activity B is dependent of A; hence, it follows A and the appropriate labels are next to and below it! Compute te using the formula: te(to + 4 t ml + tp) 6. te for A: te= 2 for B: te= 4 for C: te= 4 ... continue finding all te= ?? A: [Q;?] B: [2; ?] 2:[?;?] 4:[?;?] Now, activities C and D are dependent on the conclusion of B so we must branch out in two separate ways! copy the 6 add 4 C: [6:10] Start at 0... 0+2 A: [0:2] 2:[?;?] copy the 2 add 4 B: [2;6] 4:[?;?] 4:[?;?] 4: [2;?] copy the 6 add 4 D: [6:10] Consider the following table: ACTIVITY PREC. ACT. ABCDEFG A B C D, E, F TIME ESTIMATES tml to ANNW NW N H 2 3 2 3 2 2 NETWORK: PERT 1 - 4 3 5 4 4 5 4 5 (days) 4 7 6 5 13 6 6 te 1) Construct a PERT network. [NOTE: This is the most crucial part of the exercise. Make sure you have the correct network before proceeding to the next sections.] 2) By using ES, EF, LF, LS, find the slack of each activity and the critical path. 3) Find the completion time and the standard deviation (6) for the project-round off the standard deviation to the nearest hundredth: two decimal places. 4) What is the completion time at 99% confidence level? 5) What is the likelihood of this project being completed in more than 14 days? 6) Between 11 and 13 days?
Step by Step Solution
There are 3 Steps involved in it

Get step-by-step solutions from verified subject matter experts