

Question: To create a scatterplot with height on the x-axis, and weight on the y-axis, how would you complete the following? fig, ax= plt.subplots() ax.scatter (
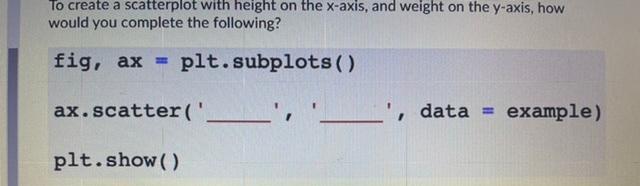
To create a scatterplot with height on the x-axis, and weight on the y-axis, how would you complete the following? fig, ax= plt.subplots() ax.scatter ( ' plt.show()
Step by Step Solution
There are 3 Steps involved in it
1 Expert Approved Answer
Step: 1 Unlock

Question Has Been Solved by an Expert!
Get step-by-step solutions from verified subject matter experts
Step: 2 Unlock
Step: 3 Unlock