

Question: To keep this filling_process under control, eight tubs are pulled randomly from the assembly line. After several days, the data shown in the following table
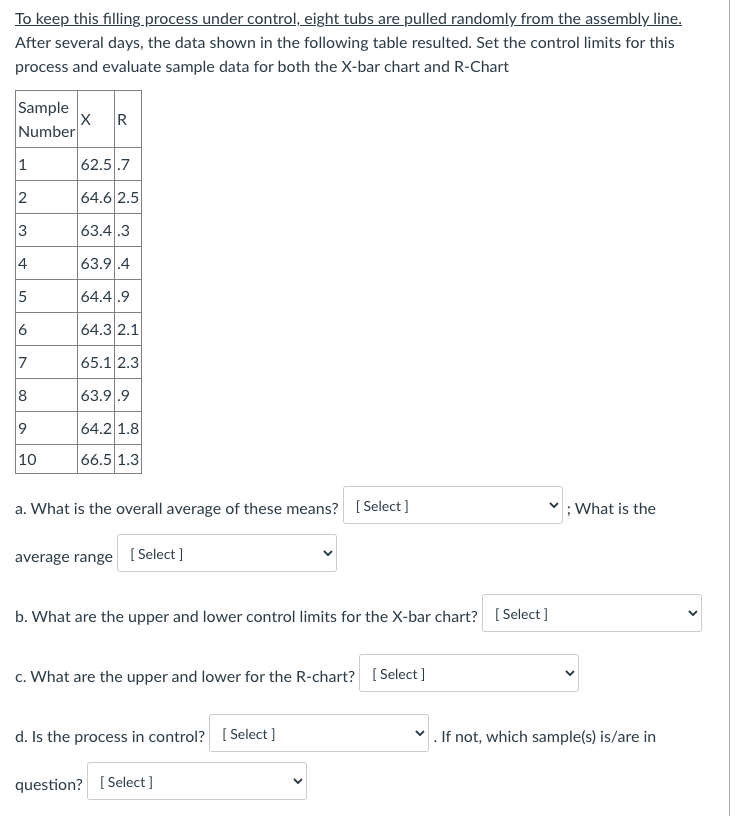
To keep this filling_process under control, eight tubs are pulled randomly from the assembly line. After several days, the data shown in the following table resulted. Set the control limits for this process and evaluate sample data for both the X-bar chart and R-Chart a. What is the overall average of these means? ; What is the average range b. What are the upper and lower control limits for the X-bar chart? c. What are the upper and lower for the R-chart? d. Is the process in control? If not, which sample(s) is/are in
Step by Step Solution
There are 3 Steps involved in it
1 Expert Approved Answer
Step: 1 Unlock

Question Has Been Solved by an Expert!
Get step-by-step solutions from verified subject matter experts
Step: 2 Unlock
Step: 3 Unlock