

Question: c. What are the upper and lower for the R-chart? [ Select ] [3.89 and .15, 2.46 and .18, 3.55 and .22, 2.82 and .25,
c. What are the upper and lower for the R-chart? [ Select ] ["3.89 and .15", "2.46 and .18", "3.55 and .22", "2.82 and .25", "3.57 and 0"]
d. Is the process in control? [ Select ] ["no", "cannot determine from the data", "both the x-chart and r-chart are within the process limits", "yes"] . If not, which sample(s) is/are in question? [ Select ] ["x-chart samples (1, 3, 7, 10); r-chart sample (2)", "x-chart samples (2, 3, 8, 9); r-chart samples - all in control", "x-chart samples (1, 3, 7, 8); r-chart samples - in control", "All of the data points are in control"]
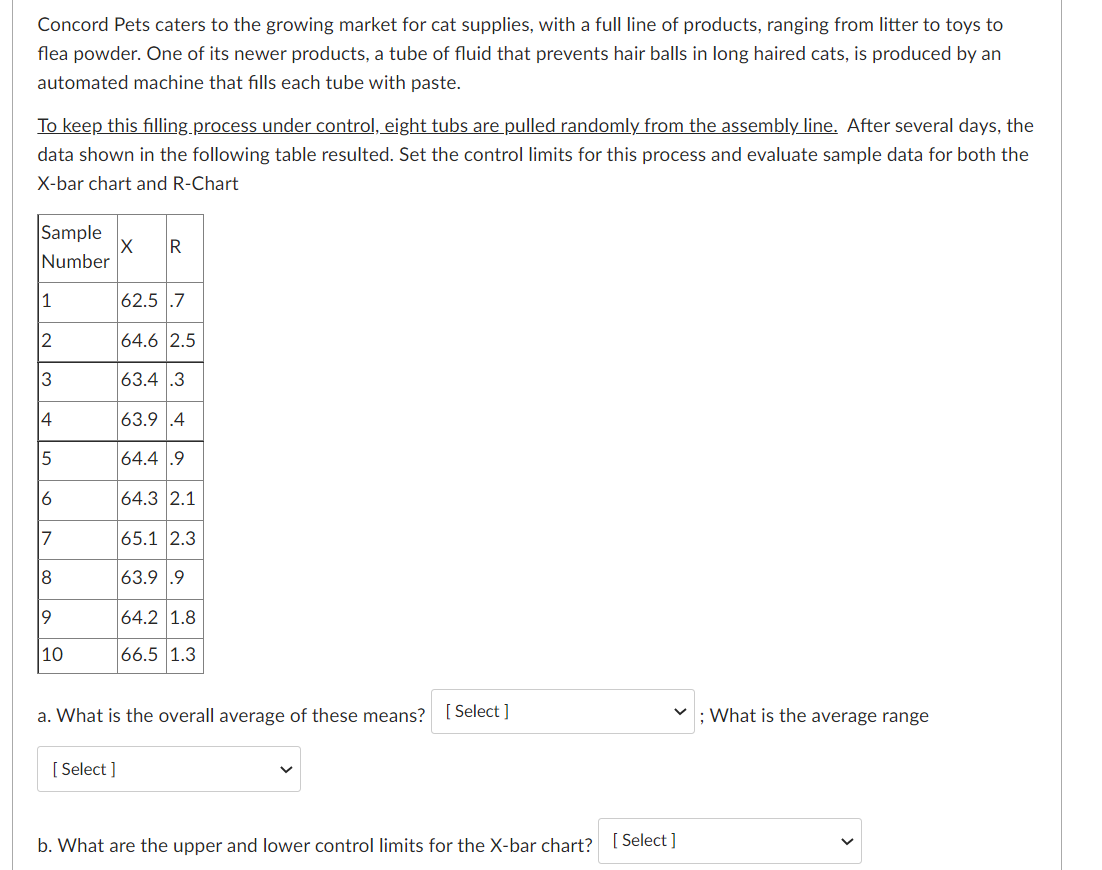
Concord Pets caters to the growing market for cat supplies, with a full line of products, ranging from litter to toys to flea powder. One of its newer products, a tube of fluid that prevents hair balls in long haired cats, is produced by an automated machine that fills each tube with paste. To keep this filling.process under control, eight tubs are pulled randomly from the assembly line. After several days, the data shown in the following table resulted. Set the control limits for this process and evaluate sample data for both the X-bar chart and R-Chart a. What is the overall average of these means? ; What is the average range b. What are the upper and lower control limits for the X-bar chartStep by Step Solution
There are 3 Steps involved in it
1 Expert Approved Answer
Step: 1 Unlock

Question Has Been Solved by an Expert!
Get step-by-step solutions from verified subject matter experts
Step: 2 Unlock
Step: 3 Unlock