

Question: To receive full points, I expect to see a graph and full explanations of your process and calculations. Elderly individuals may have difficulty standing straight
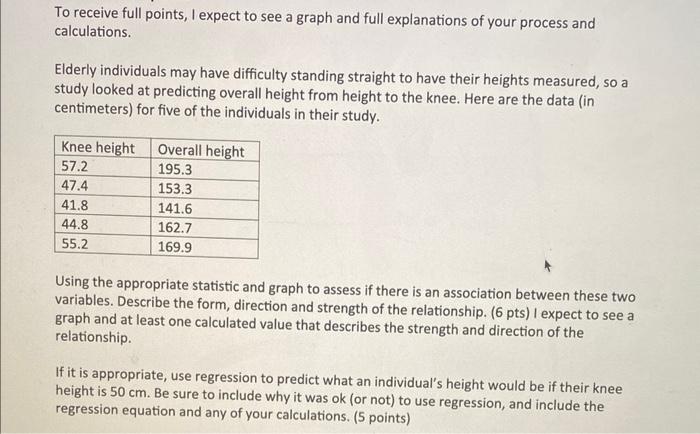
To receive full points, I expect to see a graph and full explanations of your process and calculations. Elderly individuals may have difficulty standing straight to have their heights measured, so a study looked at predicting overall height from height to the knee. Here are the data (in centimeters) for five of the individuals in their study. Using the appropriate statistic and graph to assess if there is an association between these two variables. Describe the form, direction and strength of the relationship. ( 6 pts) I expect to see a graph and at least one calculated value that describes the strength and direction of the relationship. If it is appropriate, use regression to predict what an individual's height would be if their knee height is 50cm. Be sure to include why it was ok (or not) to use regression, and include the regression equation and any of your calculations. (5 points)
Step by Step Solution
There are 3 Steps involved in it

Get step-by-step solutions from verified subject matter experts