

Question: To study the phase changes as water is heated from solid to liquid to water vapor. Connections to What You Already Know About in
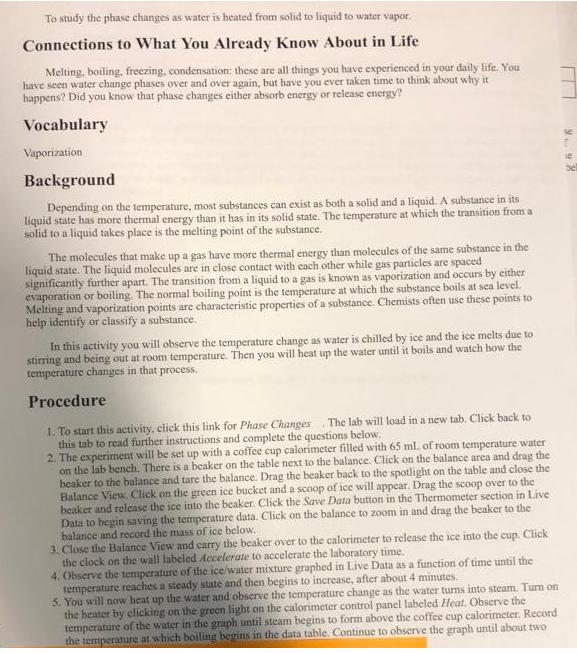
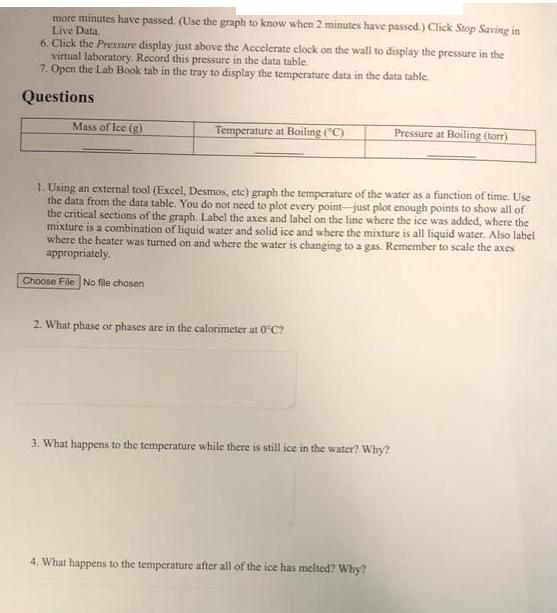
To study the phase changes as water is heated from solid to liquid to water vapor. Connections to What You Already Know About in Life Melting, boiling, freezing, condensation: these are all things you have experienced in your daily life. You have seen water change phases over and over again, but have you ever taken time to think about why it happens? Did you know that phase changes either absorb energy or release energy? Vocabulary Vaporization Background Depending on the temperature, most substances can exist as both a solid and a liquid. A substance in its liquid state has more thermal energy than it has in its solid state. The temperature at which the transition from a solid to a liquid takes place is the melting point of the substance. The molecules that make up a gas have more thermal energy than molecules of the same substance in the liquid state. The liquid molecules are in close contact with each other while gas particles are spaced significantly further apart. The transition from a liquid to a gas is known as vaporization and occurs by either evaporation or boiling. The normal boiling point is the temperature at which the substance boils at sea level. Melting and vaporization points are characteristic properties of a substance. Chemists often use these points to help identify or classify a substance. In this activity you will observe the temperature change as water is chilled by ice and the ice melts due to stirring and being out at room temperature. Then you will heat up the water until it boils and watch how the temperature changes in that process. Procedure 1. To start this activity, click this link for Phase Changes. The lab will load in a new tab. Click back to this tab to read further instructions and complete the questions below. 2. The experiment will be set up with a coffee cup calorimeter filled with 65 ml. of room temperature water on the lab bench. There is a beaker on the table next to the balance. Click on the balance area and drag the beaker to the balance and tare the balance. Drag the beaker back to the spotlight on the table and close the Balance View, Click on the green ice bucket and a scoop of ice will appear. Drag the scoop over to the beaker and release the ice into the beaker. Click the Save Data button in the Thermometer section in Live Data to begin saving the temperature data. Click on the balance to zoom in and drag the beaker to the balance and record the mass of ice below. 3. Close the Balance View and carry the beaker over to the calorimeter to release the ice into the cup. Click the clock on the wall labeled Accelerate to accelerate the laboratory time. 4. Observe the temperature of the ice/water mixture graphed in Live Data as a function of time until the temperature reaches a steady state and then begins to increase, after about 4 minutes. 5. You will now heat up the water and observe the temperature change as the water turns into steam. Turn on the heater by clicking on the green light on the calorimeter control panel labeled Heat. Observe the temperature of the water in the graph until steam begins to form above the coffee cup calorimeter. Record the temperature at which boiling begins in the data table. Continue to observe the graph until about two 85-8 more minutes have passed. (Use the graph to know when 2 minutes have passed.) Click Stop Saving in Live Data. 6. Click the Pressure display just above the Accelerate clock on the wall to display the pressure in the virtual laboratory. Record this pressure in the data table. 7. Open the Lab Book tab in the tray to display the temperature data in the data table. Questions Mass of Ice (g) Temperature at Boiling ("C) Choose File No file chosen 1. Using an external tool (Excel, Desmos, etc) graph the temperature of the water as a function of time. Use the data from the data table. You do not need to plot every point-just plot enough points to show all of the critical sections of the graph. Label the axes and label on the line where the ice was added, where the mixture is a combination of liquid water and solid ice and where the mixture is all liquid water. Also label where the heater was turned on and where the water is changing to a gas. Remember to scale the axes appropriately. 2. What phase or phases are in the calorimeter at 0C? 3. What happens to the temperature while there is still ice in the water? Why? Pressure at Boiling (torr) 4. What happens to the temperature after all of the ice has melted? Why?
Step by Step Solution
3.44 Rating (173 Votes )
There are 3 Steps involved in it
1 Mass of Ice g During the experiment you used a balance to measure the mass of the ice before addin... View full answer

Get step-by-step solutions from verified subject matter experts