

Question: To which element does this mass spectrum belong? a. Al b. Ne C. Na d. Mg What do the peaks on the mass spectrum represent?
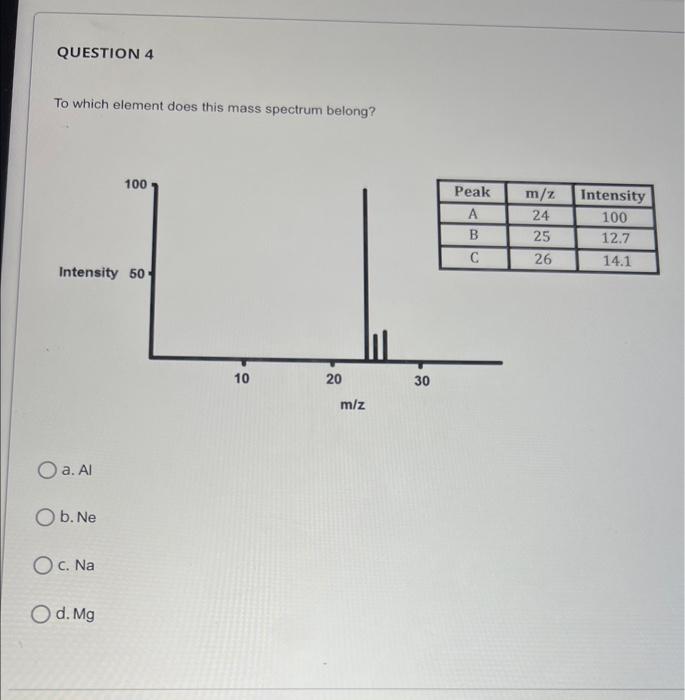
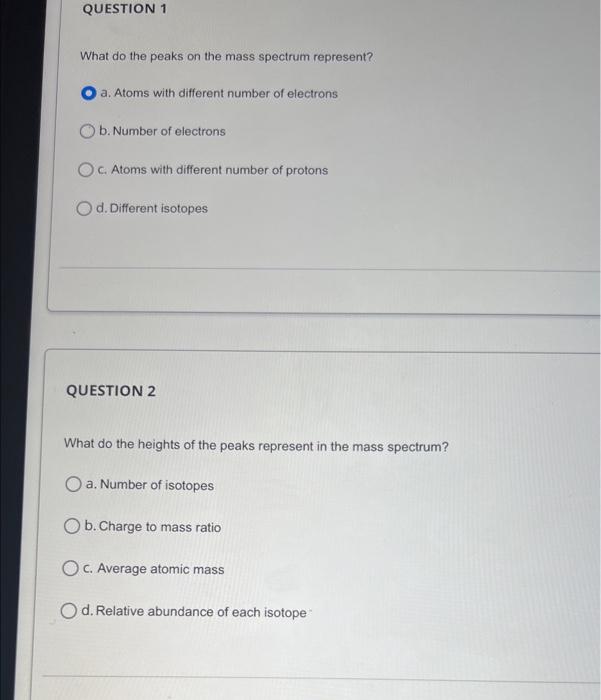
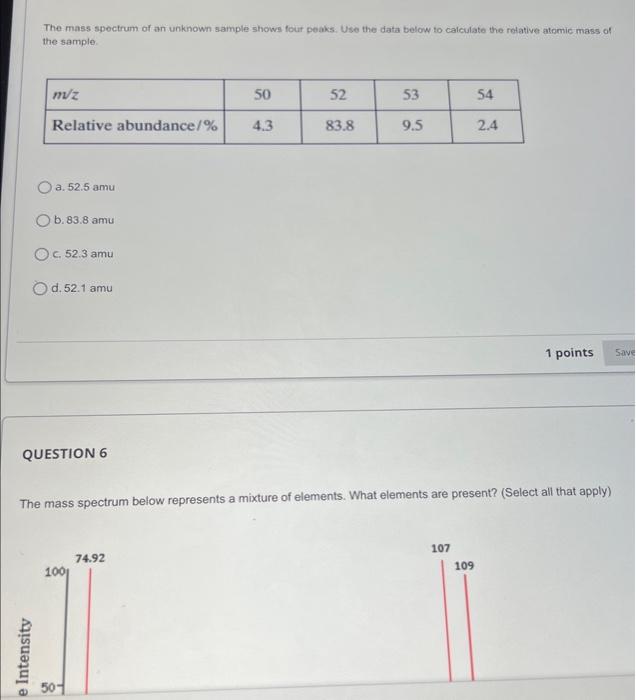
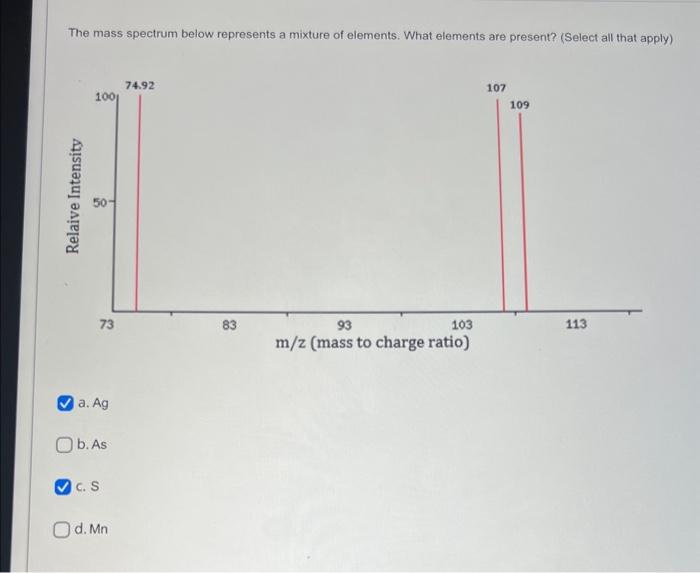
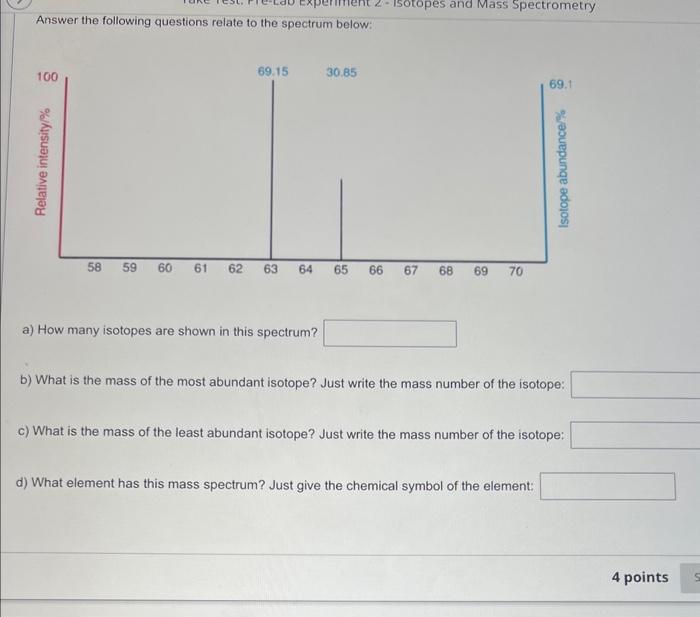
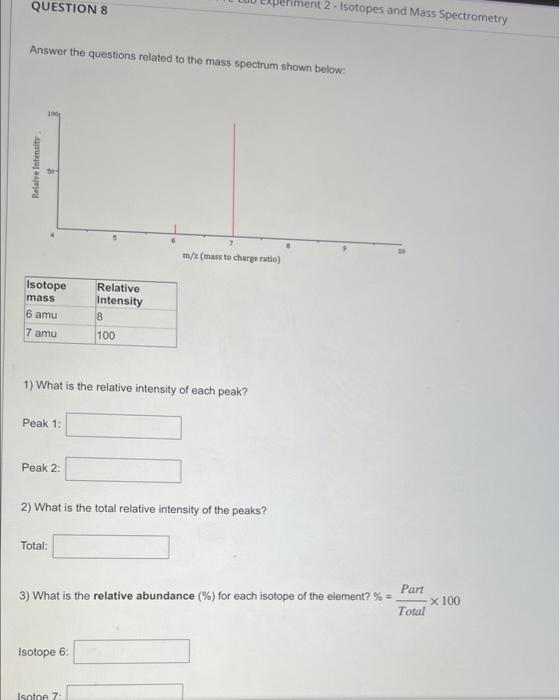
To which element does this mass spectrum belong? a. Al b. Ne C. Na d. Mg What do the peaks on the mass spectrum represent? a. Atoms with different number of electrons b. Number of electrons C. Atoms with different number of protons d. Different isotopes QUESTION 2 What do the heights of the peaks represent in the mass spectrum? a. Number of isotopes b. Charge to mass ratio c. Average atomic mass d. Relative abundance of each isotope The mass spectrum of an unknown sample shows four peaks. Use the data below to calculate the relative atomic mass of the sample. a. 52.5amu b. 83.8amu c. 52.3amu d. 52.1amu QUESTION 6 The mass spectrum below represents a mixture of elements. What elements are present? (Select all that apply) The mass spectrum below represents a mixture of elements. What elements are present? (Select all that apply) a. Ag b. As C. S d. Mn Answer the following questions relate to the spectrum below: a) How many isotopes are shown in this spectrum? b) What is the mass of the most abundant isotope? Just write the mass number of the isotope: c) What is the mass of the least abundant isotope? Just write the mass number of the isotope: d) What element has this mass spectrum? Just give the chemical symbol of the element: Answer the questions related to the mass spectrum shown below: 1) What is the relative intensity of each peak? Peak 1: Peak 2: 2) What is the total relative intensity of the peaks? Total: 3) What is the relative abundance (%) for each isotope of the element? %=TotalPart100
Step by Step Solution
There are 3 Steps involved in it

Get step-by-step solutions from verified subject matter experts