

Question: to your a) Consider the plasma data. Save it from my courses on your computer and read it in R. Examine the top few entries
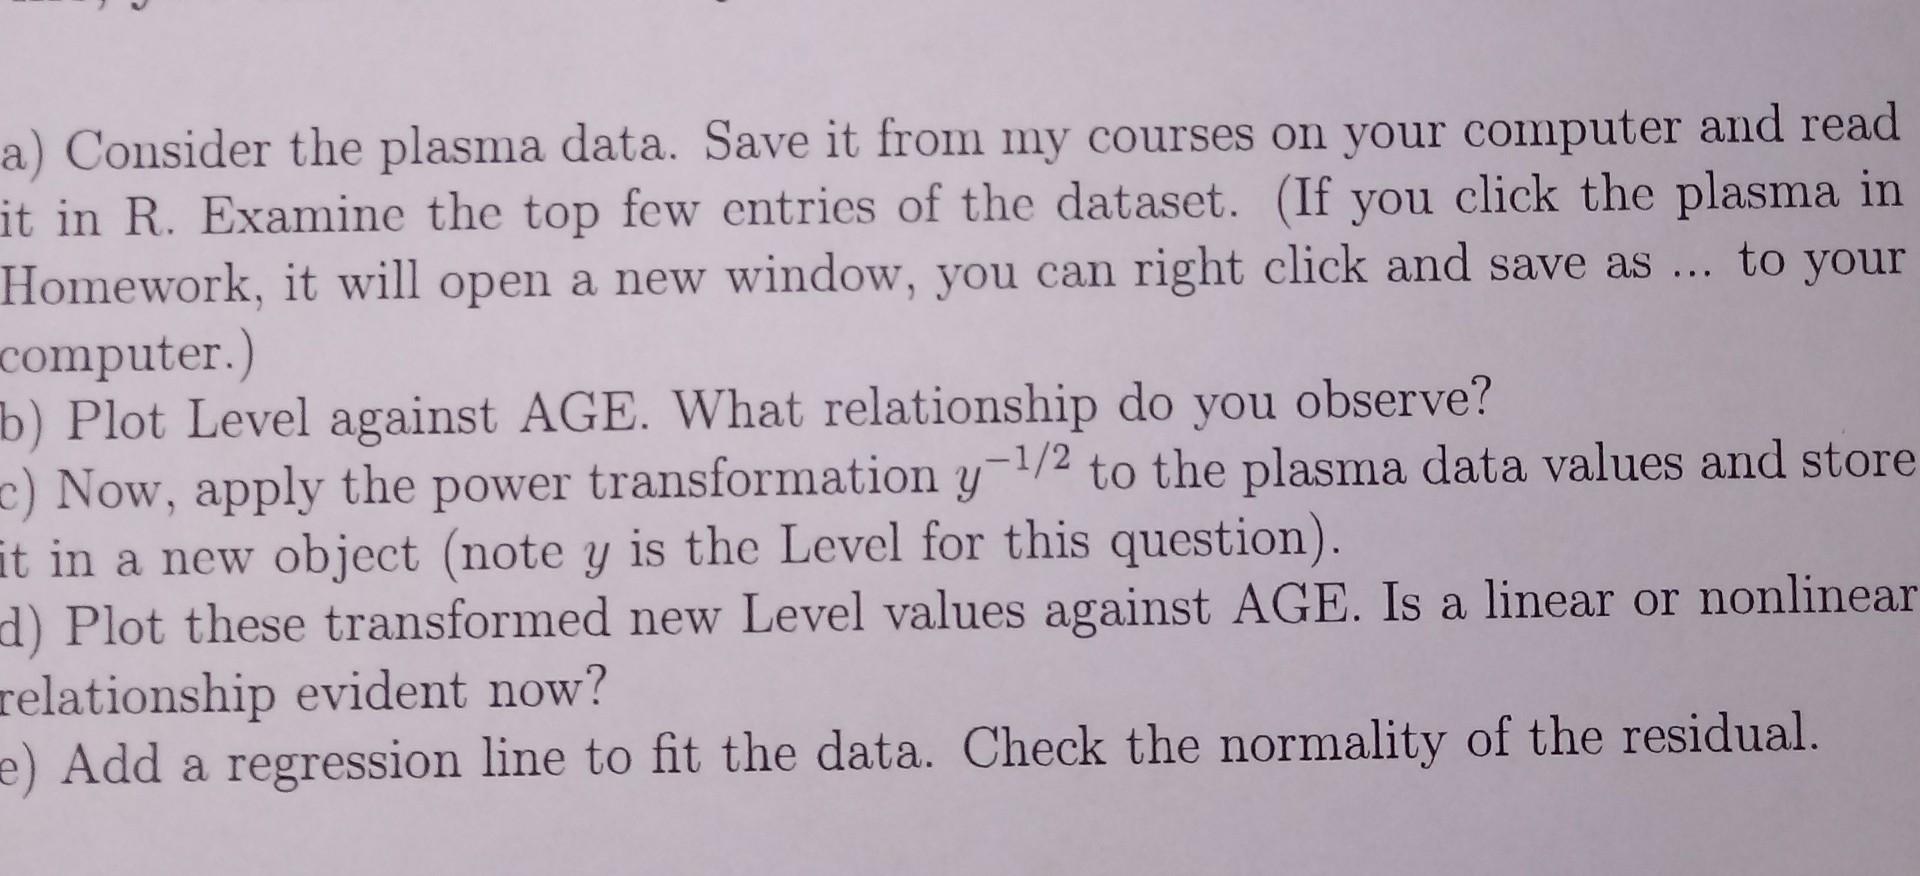
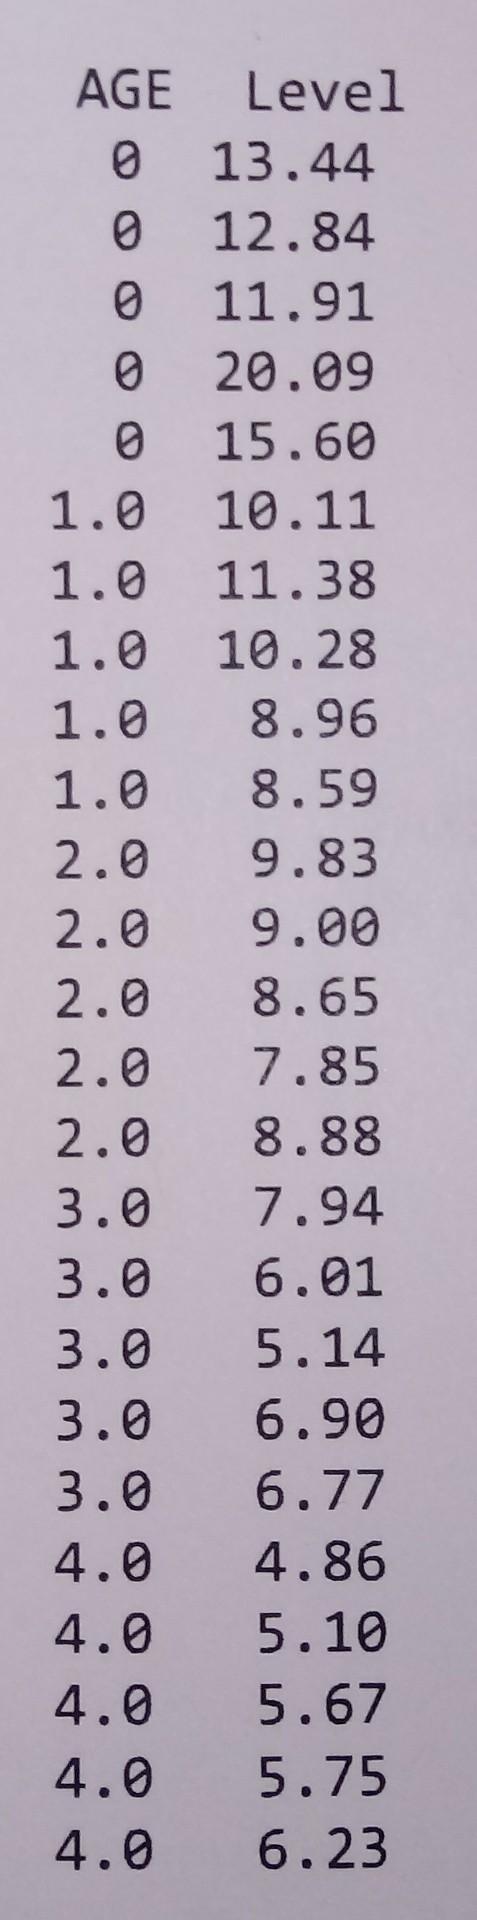
to your a) Consider the plasma data. Save it from my courses on your computer and read it in R. Examine the top few entries of the dataset. (If you click the plasma in Homework, it will open a new window, you can right click and save as ... computer.) b) Plot Level against AGE. What relationship do you observe? c) Now, apply the power transformation y-1/2 to the plasma data values and store it in a new object (note y is the Level for this question). d) Plot these transformed new Level values against AGE. Is a linear or nonlinear relationship evident now? e) Add a regression line to fit the data. Check the normality of the residual. AGE Level 13.44 12.84 11.91 0 20.09 15.60 1.0 10.11 1.0 11.38 1.0 10.28 1.0 8.96 1.0 8.59 2.0 9.83 2.0 9.00 2.0 8.65 2.0 7.85 2.0 8.88 3.0 7.94 3.0 6.01 3.0 5.14 3.0 6.90 3.0 6.77 4.0 4.86 4.0 5.10 4.0 5.67 4.0 5.75 4.0 6.23 to your a) Consider the plasma data. Save it from my courses on your computer and read it in R. Examine the top few entries of the dataset. (If you click the plasma in Homework, it will open a new window, you can right click and save as ... computer.) b) Plot Level against AGE. What relationship do you observe? c) Now, apply the power transformation y-1/2 to the plasma data values and store it in a new object (note y is the Level for this question). d) Plot these transformed new Level values against AGE. Is a linear or nonlinear relationship evident now? e) Add a regression line to fit the data. Check the normality of the residual. AGE Level 13.44 12.84 11.91 0 20.09 15.60 1.0 10.11 1.0 11.38 1.0 10.28 1.0 8.96 1.0 8.59 2.0 9.83 2.0 9.00 2.0 8.65 2.0 7.85 2.0 8.88 3.0 7.94 3.0 6.01 3.0 5.14 3.0 6.90 3.0 6.77 4.0 4.86 4.0 5.10 4.0 5.67 4.0 5.75 4.0 6.23
Step by Step Solution
There are 3 Steps involved in it

Get step-by-step solutions from verified subject matter experts