

Question: TOPIC 5 - Categorical Data Analysis 5.1 The following table reports the single most important safety feature for a random sample of 100 car buyers.
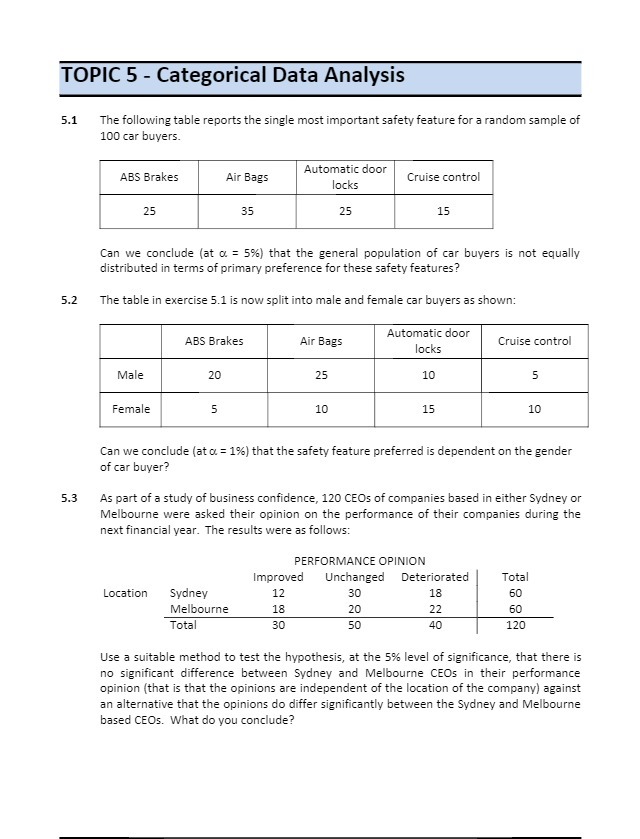
TOPIC 5 - Categorical Data Analysis 5.1 The following table reports the single most important safety feature for a random sample of 100 car buyers. ABS Brakes Automatic door Air Bags Cruise control ocks 25 35 25 15 Can we conclude (at o = 5%) that the general population of car buyers is not equally distributed in terms of primary preference for these safety features? 5.2 The table in exercise 5.1 is now split into male and female car buyers as shown: ABS Brakes Automatic door Air Bags Cruise control locks Male 20 25 10 5 Female 5 10 15 10 Can we conclude (at o = 1%) that the safety feature preferred is dependent on the gender of car buyer? 5.3 As part of a study of business confidence, 120 CEOs of companies based in either Sydney or Melbourne were asked their opinion on the performance of their companies during the next financial year. The results were as follows: PERFORMANCE OPINION Improved Unchanged Deteriorated Total Location Sydney 12 30 18 60 Melbourne 18 20 22 60 Total 30 50 40 120 Use a suitable method to test the hypothesis, at the 5% level of significance, that there is no significant difference between Sydney and Melbourne CEOs in their performance opinion (that is that the opinions are independent of the location of the company) against an alternative that the opinions do differ significantly between the Sydney and Melbourne based CEOS. What do you conclude
Step by Step Solution
There are 3 Steps involved in it

Get step-by-step solutions from verified subject matter experts