

Question: Topic: k-Nearest Neighbor (k-NN) Please show step by step on how you solved the problem. Problem 2: k-Nearest Neighbor (k-NN) In this problem, you are
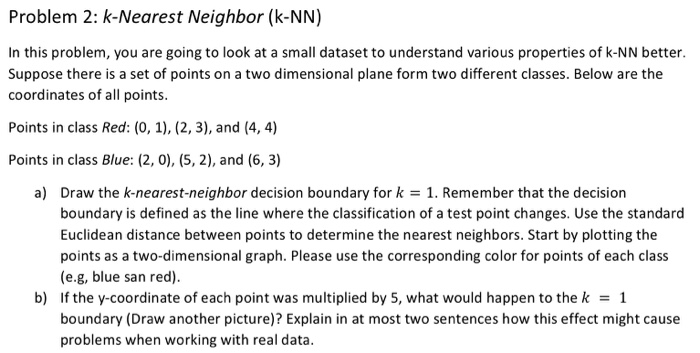
Problem 2: k-Nearest Neighbor (k-NN) In this problem, you are going to look at a small dataset to understand various properties of k-NN better Suppose there is a set of points on a two dimensional plane form two different classes. Below are the coordinates of all points. Points in class Red: (0, 1), (2, 3), and (4, 4) Points in class Blue: (2, 0), (5, 2), and (6, 3) a) Draw the k-nearest-neighbor decision boundary for k = 1, Remember that the decision boundary is defined as the line where the classification of a test point changes. Use the standard Euclidean distance between points to determine the nearest neighbors. Start by plotting the points as a two-dimensional graph. Please use the corresponding color for points of each class (e.g, blue san red). If the y-coordinate of each point was multiplied by 5, what would happen to the k = 1 boundary (Draw another picture)? Explain in at most two sentences how this effect might cause problems when working with real data. b)
Step by Step Solution
There are 3 Steps involved in it

Get step-by-step solutions from verified subject matter experts