

Question: Topic: Limits and Continuity For the function = to the right, what value does y appear to approach? The notion of an asymptote can be
Topic: Limits and Continuity
For the function
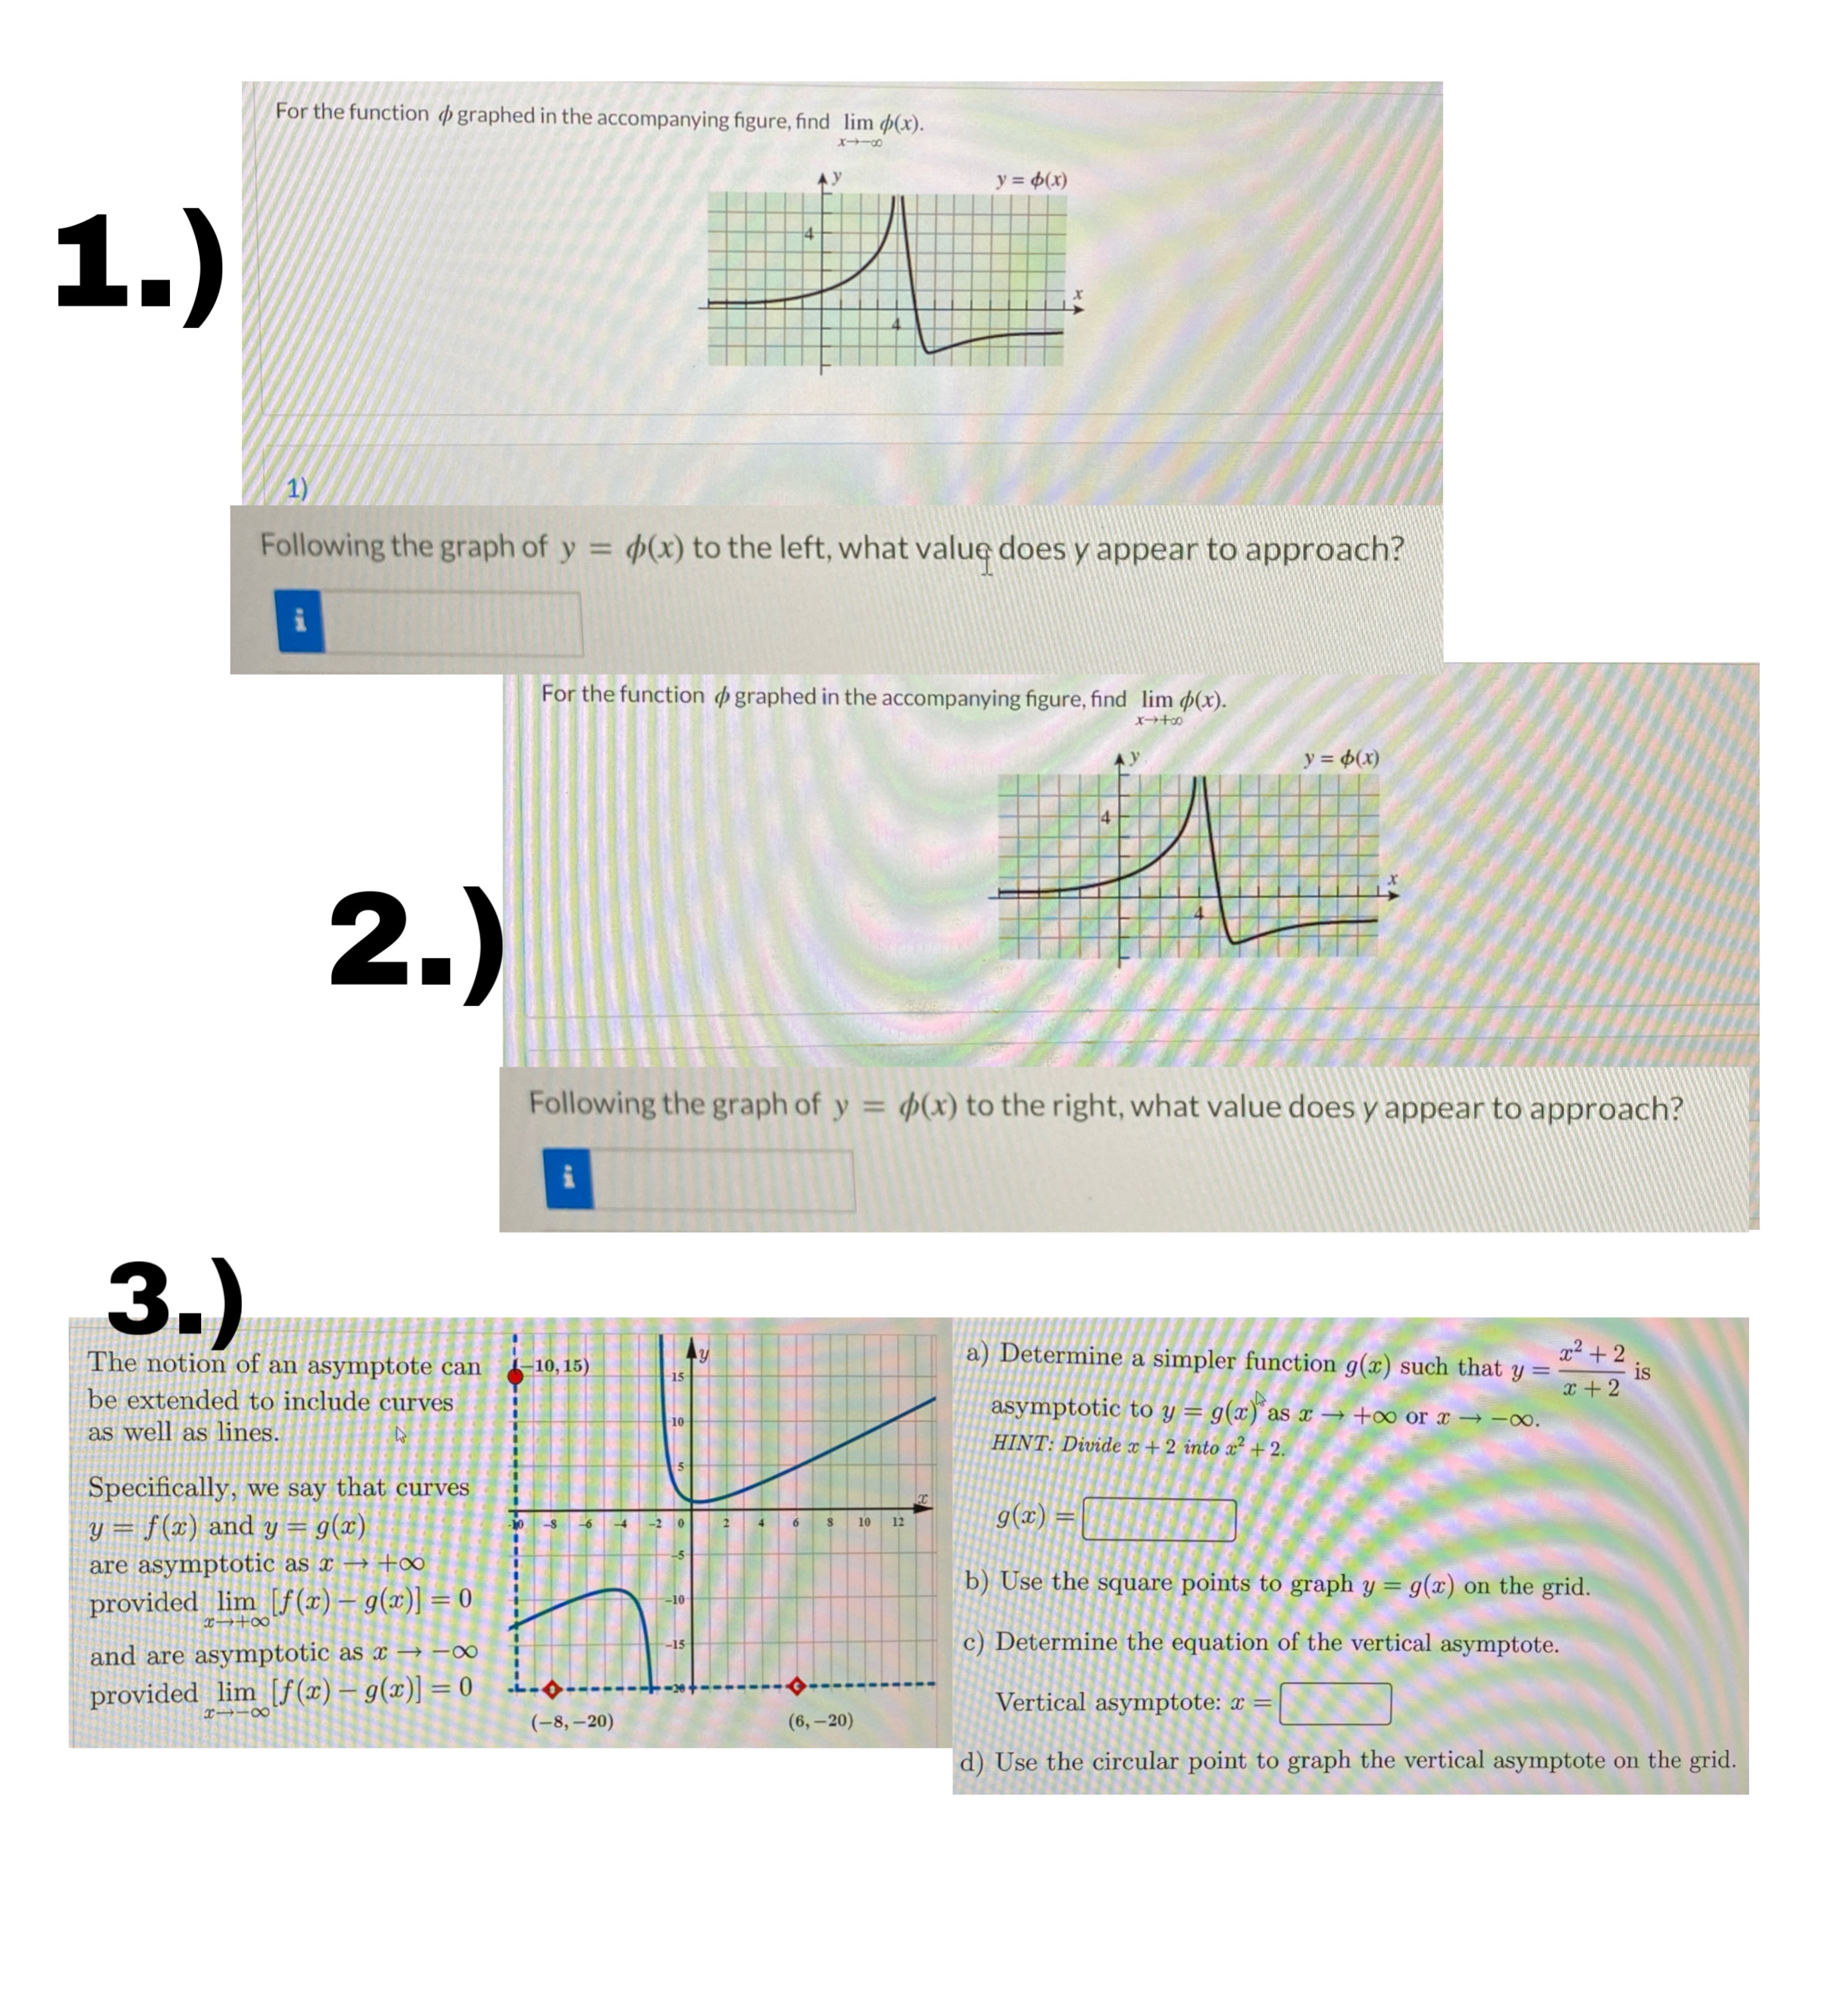
= to the right, what value does y appear to approach? The notion of an asymptote can be extended to include curves as well as lines. Specifically, we say that curves y f (a;) and y g(c) are asymptotic as + +00 provided lim [f (a;) g(:r)] = and are asymptotic as i provided lim [f@) g@)] = For the function d) graphed in the accompanying figure, find lim Following the graph of y = to the left, what valut does y appear to approach? For the function graphed in the accompanying figure, find lim Ax). (6, 20) (8, 20) Following the graph of y 10, 15) 15 10 -10 {4+44 a) Determine a simpler function g(c) such that y = asymptotic to y g(a;) as i +00 or + 00. HINT: Divide +2 into + 2. b) Use the square points to graph y = on the grid. c) Determine the equation of the vertical asymptote. Vertical asymptote: = d) Use the circular point to graph the vertical asymptote on the grid.
Step by Step Solution
There are 3 Steps involved in it

Get step-by-step solutions from verified subject matter experts