

Question: Topic Specific Assignment #1 Spend Analysis Spend Analysis is defined as an annual review of the organizations total purchases, which provides answers to a series
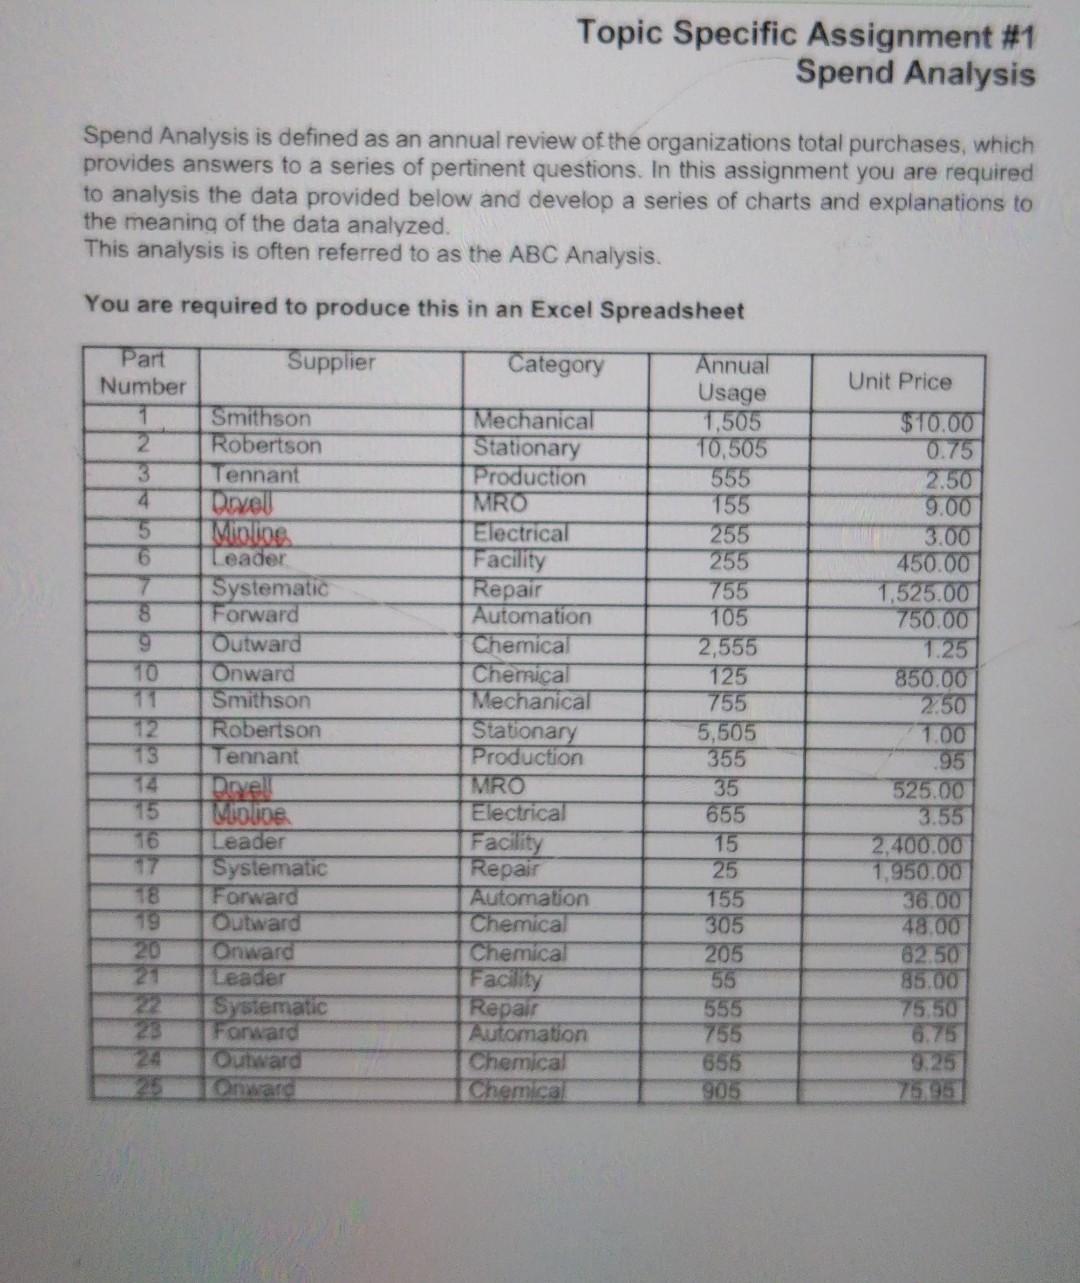
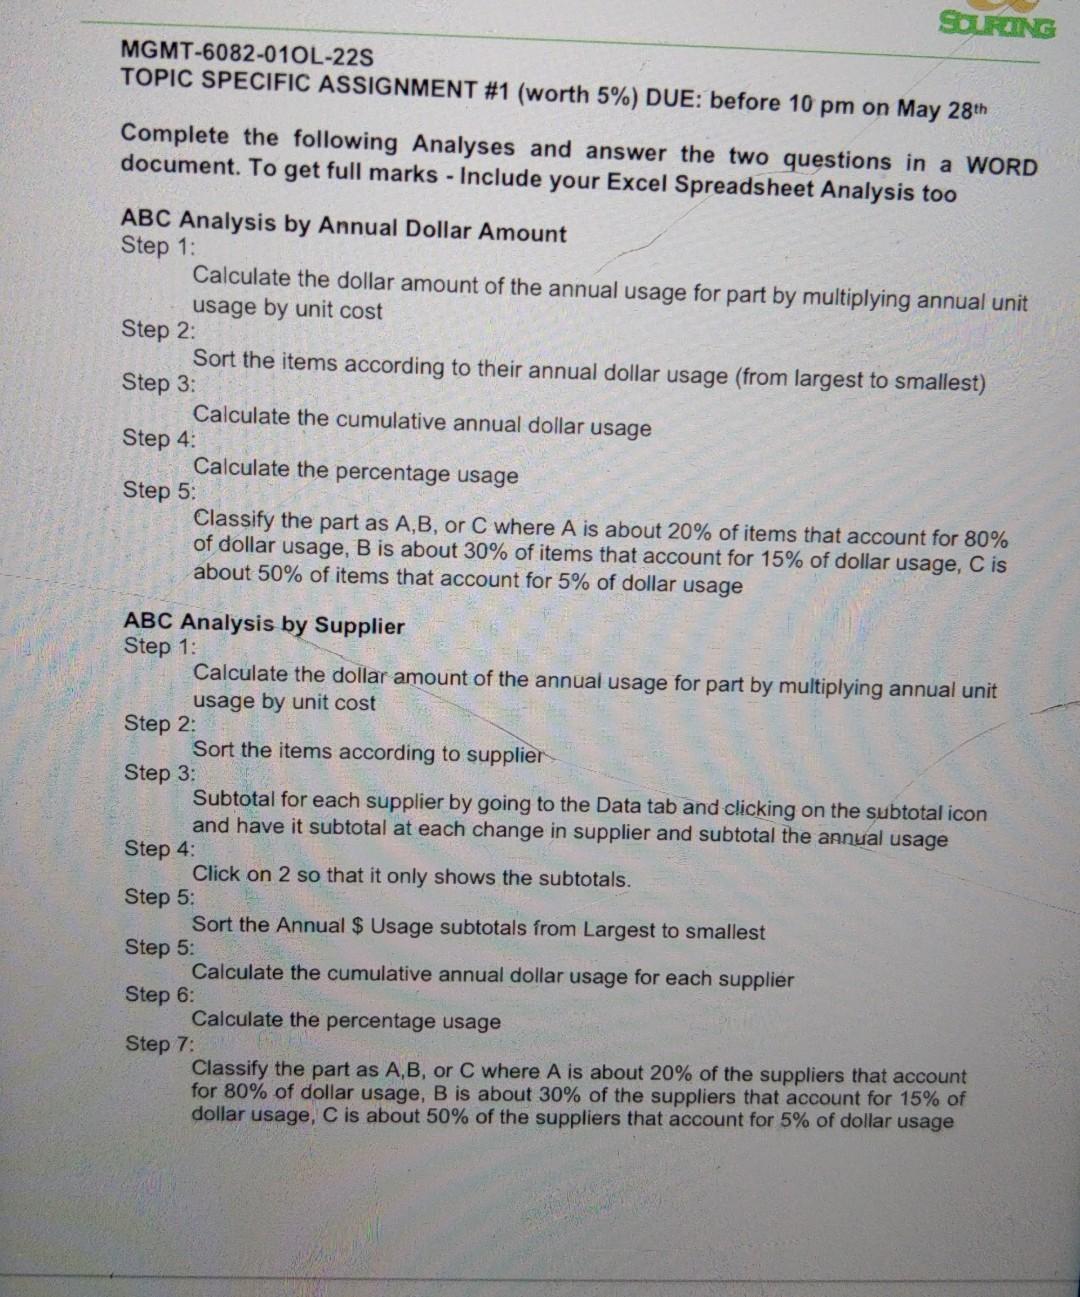
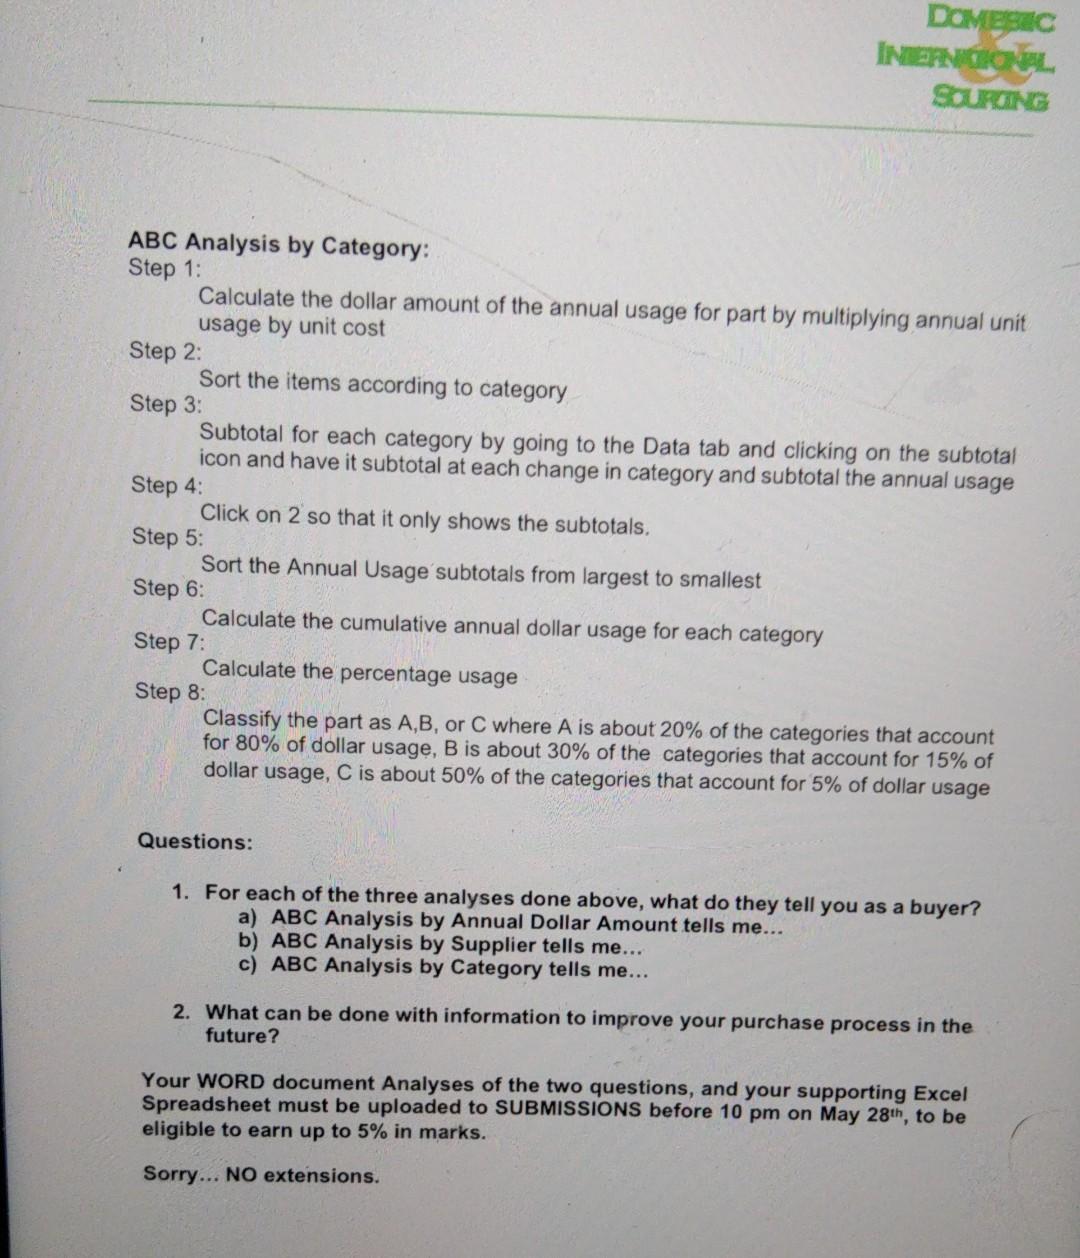
Topic Specific Assignment #1 Spend Analysis Spend Analysis is defined as an annual review of the organizations total purchases, which provides answers to a series of pertinent questions. In this assignment you are required to analysis the data provided below and develop a series of charts and explanations to the meaning of the data analyzed. This analysis is often referred to as the ABC Analysis. You are required to produce this in an Excel Spreadsheet Part Supplier Category Annual Unit Price Number Usage 1 Smithson Mechanical 1,505 2 Robertson Stationary 10,505 3 Tennant Production 555 4 Divell MRO 155 5 Molipe Electrical 255 Leader Facility 255 7 Systematic Repair 755 8 Forward Automation 105 Outward Chemical 2,555 10 Onward Chemical 125 Smithson Mechanical 755 12 Robertson Stationary 5,505 13 Tennant Production 355 Divell MRO 35 15 Moline Electrical 655 16 Leader Facility 15 Systematic Repair 25 18 Forward Automation 155 19 Outward Chemical 305 20 Onward Chemical 205 Leader Facility 55 Systematic Repair 555 23 Forward Automation 755 24 Outward Chemical 655 25 Onward Chemical 905 $10.00 0.75 2.50 9.00 3.00 450.00 1,525.00 750.00 1.25 850.00 2.50 1.00 95 525.00 3.55 2,400.00 1,950.00 36.00 48.00 62.50 85.00 75.50 6.75 9.25 75.95 SOURING MGMT-6082-01OL-22S TOPIC SPECIFIC ASSIGNMENT #1 (worth 5%) DUE: before 10 pm on May 28th Complete the following Analyses and answer the two questions in a WORD document. To get full marks - Include your Excel Spreadsheet Analysis too ABC Analysis by Annual Dollar Amount Step 1: Calculate the dollar amount of the annual usage for part by multiplying annual unit usage by unit cost Step 2: Sort the items according to their annual dollar usage (from largest to smallest) Step 3: Calculate the cumulative annual dollar usage Step 4: Calculate the percentage usage Step 5: Classify the part as A,B, or C where A is about 20% of items that account for 80% of dollar usage, B is about 30% of items that account for 15% of dollar usage, C is about 50% of items that account for 5% of dollar usage ABC Analysis by Supplier Step 1: Calculate the dollar amount of the annual usage for part by multiplying annual unit usage by unit cost Step 2: Sort the items according to supplier Step 3: Subtotal for each supplier by going to the Data tab and clicking on the subtotal icon and have it subtotal at each change in supplier and subtotal the annual usage Step 4: Click on 2 so that it only shows the subtotals. Step 5: Sort the Annual $ Usage subtotals from Largest to smallest Step 5: Calculate the cumulative annual dollar usage for each supplier Step 6: Calculate the percentage usage Step 7: Classify the part as A,B, or C where A is about 20% of the suppliers that account for 80% of dollar usage, B is about 30% of the suppliers that account for 15% of dollar usage, C is about 50% of the suppliers that account for 5% of dollar usage DOMESIC INTERNICIONAL SOURCING ABC Analysis by Category: Step 1: Calculate the dollar amount of the annual usage for part by multiplying annual unit usage by unit cost Step 2: Sort the items according to category Step 3: Subtotal for each category by going to the Data tab and clicking on the subtotal icon and have it subtotal at each change in category and subtotal the annual usage Step 4: Click on 2 so that it only shows the subtotals. Step 5: Sort the Annual Usage subtotals from largest to smallest Step 6: Calculate the cumulative annual dollar usage for each category Step 7: Calculate the percentage usage Step 8: Classify the part as A,B, or C where A is about 20% of the categories that account for 80% of dollar usage, B is about 30% of the categories that account for 15% of dollar usage, C is about 50% of the categories that account for 5% of dollar usage Questions: 1. For each of the three analyses done above, what do they tell you as a buyer? a) ABC Analysis by Annual Dollar Amount tells me... b) ABC Analysis by Supplier tells me... c) ABC Analysis by Category tells me... 2. What can be done with information to improve your purchase process in the future? Your WORD document Analyses of the two questions, and your supporting Excel Spreadsheet must be uploaded to SUBMISSIONS before 10 pm on May 28th, to be eligible to earn up to 5% in marks. Sorry... NO extensions
Step by Step Solution
There are 3 Steps involved in it
1 Expert Approved Answer
Step: 1 Unlock

Question Has Been Solved by an Expert!
Get step-by-step solutions from verified subject matter experts
Step: 2 Unlock
Step: 3 Unlock