

Question: Total Points: 100 Overview: Your case study looks Home Depot and Lowes, both retail home improvement companies. Answer all questions posed completely. Instructions: Refer to
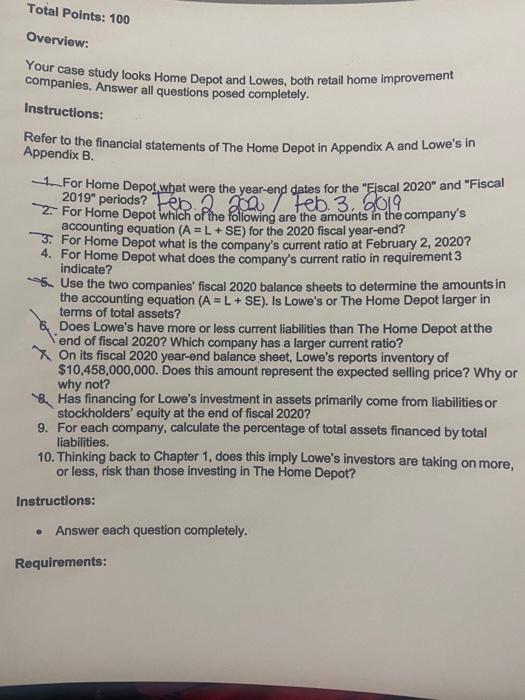
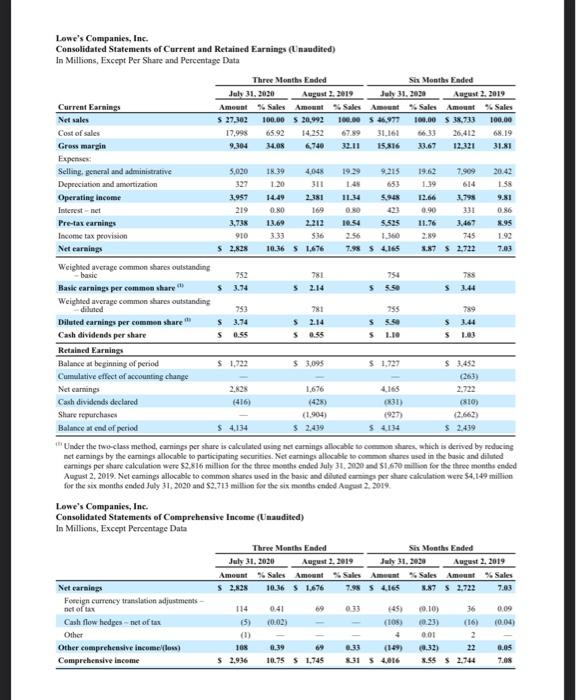
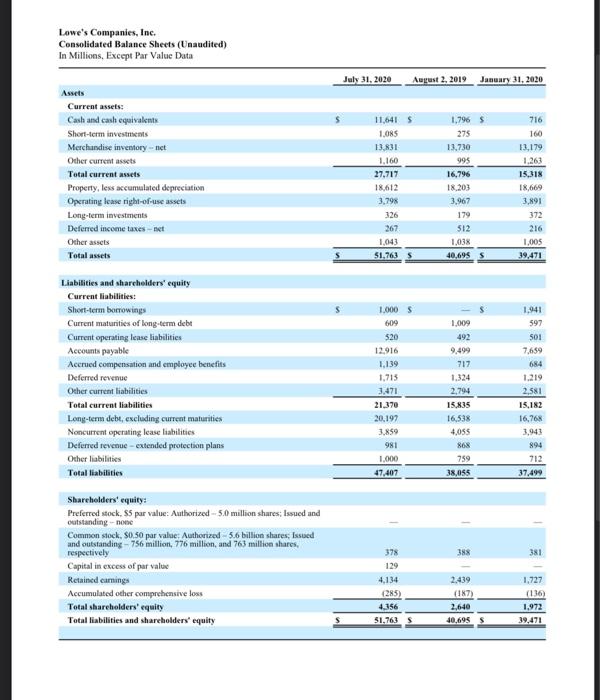
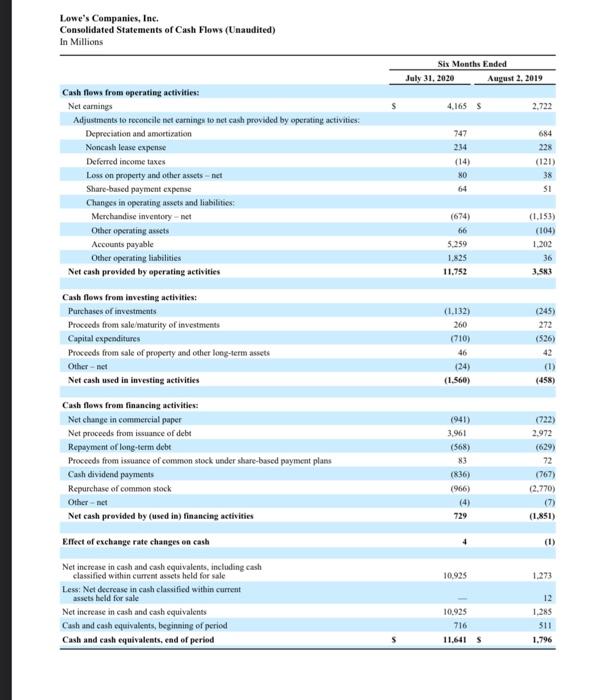
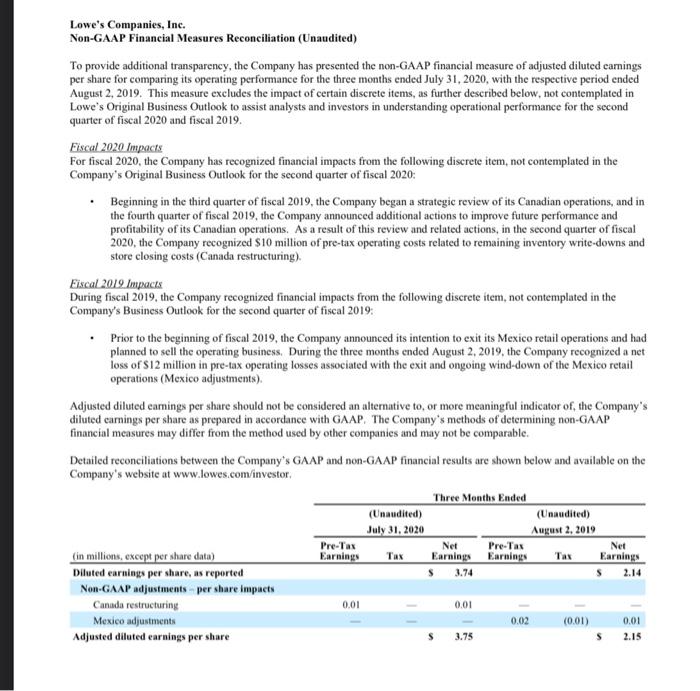
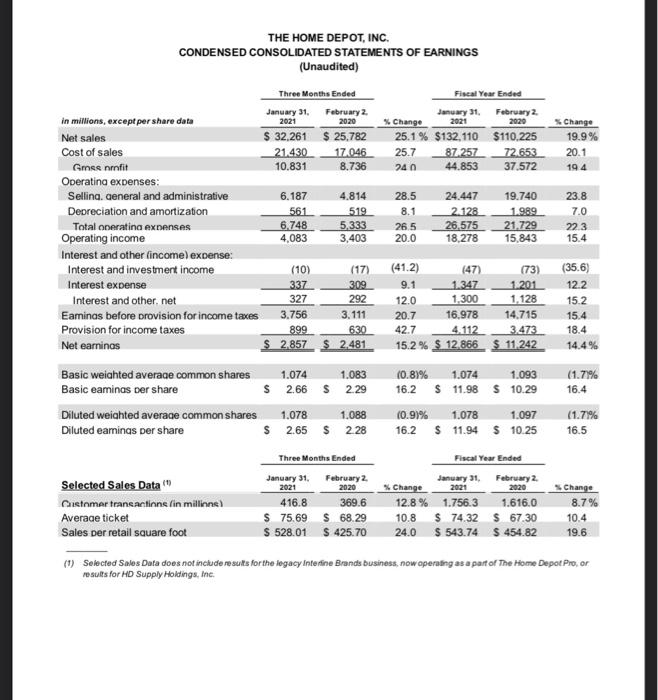
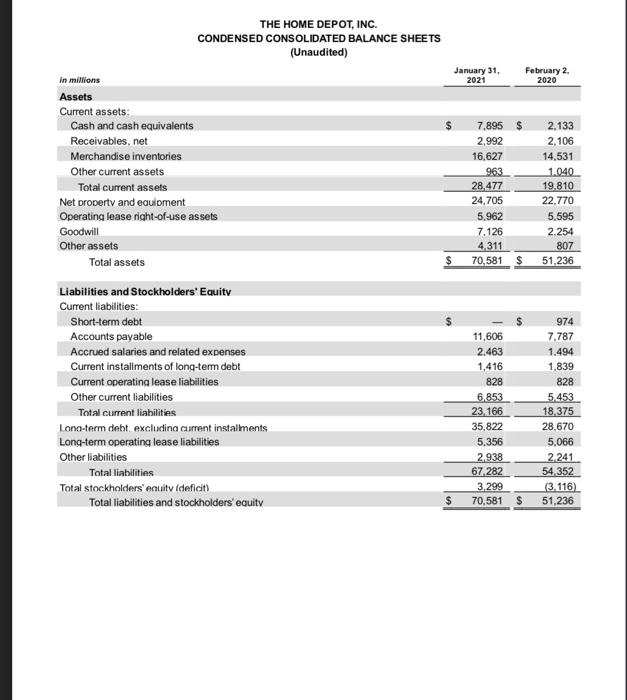
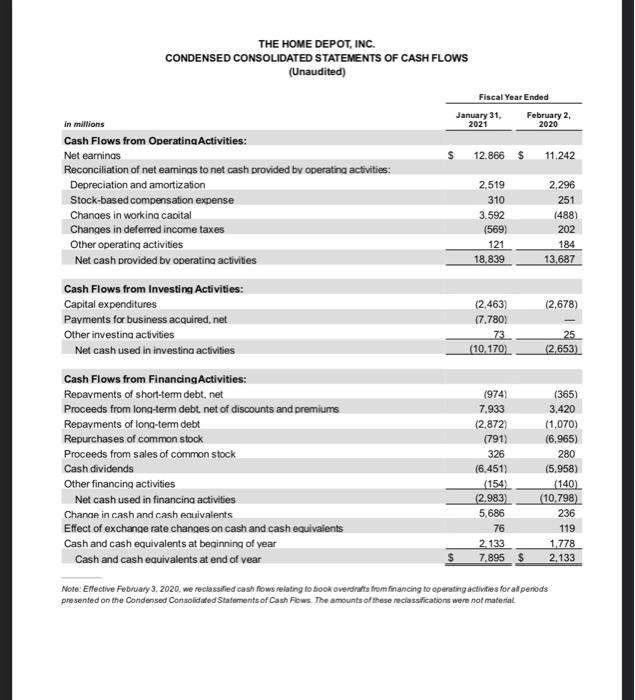
Total Points: 100 Overview: Your case study looks Home Depot and Lowes, both retail home improvement companies. Answer all questions posed completely. Instructions: Refer to the financial statements of The Home Depot in Appendix A and Lowe's in Appendix B. For Home Depot what were the year-end dates for the "Fiscal 2020" and "Fiscal 2019" periods? Tn a 2007 Feb 3, 2019 2. For Home Depot which of the following are the amounts in the company's accounting equation (A = L + SE) for the 2020 fiscal year-end? For Home Depot what is the company's current ratio at February 2, 2020? 4. For Home Depot what does the company's current ratio in requirement 3 indicate? Use the two companies' fiscal 2020 balance sheets to determine the amounts in the accounting equation (A = L + SE). Is Lowe's or The Home Depot larger in terms of total assets? Does Lowe's have more or less current liabilities than The Home Depot at the end of fiscal 2020? Which company has a larger current ratio? On its fiscal 2020 year-end balance sheet, Lowe's reports inventory of $10,458,000,000. Does this amount represent the expected selling price? Why or & Has financing for Lowe's investment in assets primarily come from liabilities or stockholders' equity at the end of fiscal 2020? 9. For each company, calculate the percentage of total assets financed by total liabilities. 10. Thinking back to Chapter 1 does this imply Lowe's investors are taking on more, or less, risk than those investing in The Home Depot? why not? Instructions: Answer each question completely. Requirements: 614 Lowe's Companies, Inc. Consolidated Statements of Current and Retained Earnings (Unaudited) In Millions. Except Per Share and Percentage Data Three Months Ended Sit Month Ended July 31, 2020 August 2019 Jul 31, 2020 August 2, 2019 Current Earnings Amount % Sales Amount Sales Amount % Sales Amount % Sales Net sales $ 17,302 100.00 $ 20,992 100.00 $ 46,977 100,00 S 38.733 100.00 Cost of sales 17,995 65.92 14.252 67.89 31.162 26,412 68.19 Gross margin 9.304 34.08 6740 32.11 15.816 33.67 12321 31.81 Expenses Selling, general and administrative 5.030 18.39 4048 19.62 7.909 Depreciation and amortization 653 1.39 158 Operating income 3.959 2.381 11:34 5.9 12.66 2.795 9.81 Interest - net 219 0.80 169 0.80 0.90 331 0.86 Pre-tax earnings 3,738 13.69 2.212 1054 5595 11.76 8.95 Income tax provision 910 333 536 3.56 1.360 2.89 745 1.92 Net earning 2,828 10.36 5 1.476 7.98 S 4.165 3.87 $ 2.722 7.03 Weighted average common shares outstanding basic 752 781 754 TS Basic earning per common share $ 3.74 5 2.14 5 55 5344 Weighted average common sares outstanding diluted 753 781 735 789 Diluted earnings per common share $ 3.74 $ 2.14 S. $3.44 Cash dividenda per share $ 0.58 $ 0.55 5 1.10 5133 Retained Earnings Balance at beginning of period $ 1,722 $ 3.095 $ 1.727 $ 3.452 Cumulative effect of accounting change (263) Net earnings 2. 1.676 4168 2.722 Cash dividends declared (416) 031) (310) Share repurchase (1.904) Balance at end of period S 4.134 $ 2.439 S4134 $ 2.439 Under the two-class method, camins per share is calculated using net cumings allocable to come shares which is derived by reducing net earnings by the carings allocable to participating securities. Net earnings allocable to common shares used in the basic and diluted camnings per share calculation were 52.816 million for the three months ended July 31.030 and $1.670 million for the three months ended August 2, 2019. Net camings allocable to common shares wed in the basic and diluted cappershare calculation were 54.149 million for the six months ended July 31, 2020 and 3.713 million for the six months ended Aug 2.2019 Lowe's Companies, Inc. Consolidated Statements of Comprehensive Income (Unaudited) In Millions, Except Percentage Data Three Months Ended Six Months Ended July 31, 2020 August 2, 2019 July 31, 2020 August 2, 2019 Amount % Sales Amount Sales Ament Sales Amount % Sales Net earnings $ 2.25 10.36 5 1.676 7.98 S 4.165 3.87 5 2.722 7.03 Foreign currency translation adjustments net of tax 0.41 033 9.10) 36 Cash flow hedges - net oftar 5) 10.02) (105) 023) (16) 10:04) Other (1) 0.01 2 Other comprehensive income foss) 168 0.39 0.33 (149) 032) 22 6,05 Comprehensive income S 2.936 10.75 S 1,745 1 $ 4,016 3.55 $ 2.744 7.08 0:09 67 Lowe's Companies, Inc. Consolidated Balance Sheets (Unaudited) In Millions, Except Par Value Data July 31, 2020 August 2, 2019 January 31, 2020 716 Assets Current assets: Cash and cash equivalent Short-term investments Merchandise inventory --net Other current assets Total current assets Property, less accumulated depreciation Operating lease right-of-use assets Long-term investments Deferred income taxes-net Other assets Total assets 11.641 1,085 13.831 1.160 27,717 18.612 3,798 326 267 1,043 51.763 5 1,796 $ 275 13.730 995 16,796 18.203 3,967 179 160 13.179 1.261 15,318 18.669 3,891 372 512 216 1,038 40,695 s 1,005 39,471 Liabilities and shareholders' equity Current liabilities: Short-term borrowings Current matunities of long-term debt Current operating lease liabilities Accounts payable Accrued compensation and employee benefits Deferred revenue Other current liabilities Total current liabilities Long-term debt, excluding current maturities Noncurrent operating lease liabilities Deferred revenue-extended protection plans Other liabilities Total liabilities 1.000 609 520 12,916 1.139 1,715 3.471 21.370 20.197 3.859 981 1.000 47,407 1.009 492 9,499 717 1.324 2,794 15.835 16,538 4,055 868 759 38,055 1,941 597 501 7.659 684 1.219 2,581 15,182 16,768 3,943 894 712 37,499 388 381 Shareholders' equity: Preferred stock, SS par value: Authorized 50 million shares; Issued and outstanding-none Common stock, 80,50 par value: Authorized - 5.6 billion shares: Issued and outstanding - 756 million, 776 million, and 763 million shares respectively Capital in excess of par value Retained carings Accumulated other comprehensive loss Total shareholders' equity Total liabilities and shareholders' equity 378 129 4.134 (285) 4.356 51,763 2,439 (187) 2,640 40,695 1.727 (136) 1,972 Lowe's Companies, Inc. Consolidated Statements of Cash Flows (Unaudited) In Millions Six Months Ended July 31, 2020 August 2, 2019 4.1655 2.722 684 228 Cash flows from operating activities: Net earnings Adjustments to reconcile net earnings to net cash provided by operating activities: Depreciation and amortization Noncash lease expense Deferred income taxes Loss on property and other assets-net Share-based payment expense Changes in operating assets and liabilities Merchandise inventory-net Other operating assets Accounts payable Other operating liabilities Net cash provided by operating activities 747 214 (14) NO 64 (121) 38 51 (674) 66 5.259 1.825 11.752 (1.153) (104) 1.202 36 3.53 (1.132) 260 (710) 46 (24) (1.560) (245) 272 (526) 42 (1) (458) Cash flows from investing activities: Purchases of investments Proceeds from sale/maturity of investments Capital expenditures Proceeds from sale of property and other long-term assets Othernet Net cash used in investing activities Cash flows from financing activities: Net change in commercial paper Net proceeds from issuance of debt Repayment of long-term debe Proceeds from issuance of common stock under share-based payment plans Cash dividend payments Repurchase of common stock Othernet Net cash provided by (used in) financing activities Effect of exchange rate changes on cash Net increase in cash and cash equivalents, including cash classified within current assets held for sale Less: Net decrease in cash classified within current assets held for sale Net increase in cash and cash equivalents Casband cash equivalents, beginning of period Cash and cash equivalents, end of period (941) 3.961 (568) 83 (836) (966) (4) 729 (722) 2.972 (629) 72 (767) (2,770) (7) (1.851) (1) 10.925 1.273 10.925 716 12 1.285 511 1.796 Lowe's Companies, Inc. Non-GAAP Financial Measures Reconciliation (Unaudited) To provide additional transparency, the Company has presented the non-GAAP financial measure of adjusted diluted earnings per share for comparing its operating performance for the three months ended July 31, 2020, with the respective period ended August 2, 2019. This measure excludes the impact of certain discrete items, as further described below, not contemplated in Lowe's Original Business Outlook to assist analysts and investors in understanding operational performance for the second quarter of fiscal 2020 and fiscal 2019. Fiscal 2020 Impacts For fiscal 2020, the Company has recognized financial impacts from the following discrete item, not contemplated in the Company's Original Business Outlook for the second quarter of fiscal 2020: Beginning in the third quarter of fiscal 2019, the Company began a strategic review of its Canadian operations, and in the fourth quarter of fiscal 2019, the Company announced additional actions to improve future performance and profitability of its Canadian operations. As a result of this review and related actions, in the second quarter of fiscal 2020, the Company recognized $10 million of pre-tax operating costs related to remaining inventory write-downs and store closing costs (Canada restructuring) Eiscal 2019. Impacts During fiscal 2019, the Company recognized financial impacts from the following discrete item, not contemplated in the Company's Business Outlook for the second quarter of fiscal 2019: Prior to the beginning of fiscal 2019, the Company announced its intention to exit its Mexico retail operations and had planned to sell the operating business. During the three months ended August 2, 2019, the Company recognized a net loss of S12 million in pre-tax operating losses associated with the exit and ongoing wind-down of the Mexico retail operations (Mexico adjustments) Adjusted diluted carings per share should not be considered an alternative to, or more meaningful indicator of the Company's diluted camnings per share as prepared in accordance with GAAP. The Company's methods of determining non-GAAP financial measures may differ from the method used by other companies and may not be comparable. Detailed reconciliations between the Company's GAAP and non-GAAP financial results are shown below and available on the Company's website at www.lowes.com/investor, Three Months Ended (Unaudited) (Unaudited) July 31, 2020 August 2, 2019 Pre-Tax Net Pre-Tax (in millions, except per share data) Earnings Earnings Earnings Tax Earnings Diluted earnings per share, as reported 3.74 2.14 Non-GAAP adjustments per share impacts Canada restructuring 0.01 0.01 Mexico adjustments 0.02 (0.01) 0.01 Adjusted diluted earnings per share 3.75 s 2.15 Net Tax $ THE HOME DEPOT, INC. CONDENSED CONSOLIDATED STATEMENTS OF EARNINGS (Unaudited) Fiscal Year Ended January 31, February 2. % Change 2021 2020 25.1% $132.110 $110.225 25.7 87.257 72.653 240 44.853 37.572 Change 19.9% 20.1 19.4 28.5 8.1 26.5 20.0 24,447 2.128 26,575 18,278 19.740 1.989 21.729 15,843 23.8 7.0 223 15.4 Three Months Ended January 31, February 2 in millions, except per share data 2021 2020 Net sales $ 32,261 $ 25,782 Cost of sales 21.430 17.046 Gmee nmfit 10.831 8.736 Operating expenses: Sellina, general and administrative 6.187 4.814 Depreciation and amortization 561 519 Total operating expenses 6.748 5.333 Operating income 4,083 3,403 Interest and other (income)expense: Interest and investment income (10) (17) Interest expense 337 309 Interest and other net 327 292 Eaminas before provision for income taxes 3.756 3.111 Provision for income taxes 899 630 Net earnings $ 2.857 $ 2,481 Basic weighted average common shares 1.074 1.083 Basic eaminas per share $ 2.66 $ 2.29 Diluted weihted average common shares 1.078 1.088 Diluted eaminas per share $ 2.65 $ 2.28 1,128 (41.2) (47) (73) 9.1 1.347 1201 12.0 1,300 20.7 16.978 14.715 42.7 4.112 3.473 15.2% $ 12.866 $ 11.242 (35.6) 122 15.2 15.4 18.4 14.4% (0.81% 16.2 1.074 $11.98 1.093 $ 10.29 (1.71% 16.4 (0.9)% 1.078 1.097 16.2 $11.94 $ 10.25 (1.71% 16.5 Three Months Ended Fiscal Year Ended Selected Sales Data Customer transactinnelin millione) Average ticket Sales per retail square foot January 31, February 2 2021 2020 416.8 369.6 $ 75.69 $ 68.29 $ 528.01 S 425.70 January 31, February 2. Change 2021 2020 12.8% 1.756.3 1.616.0 10.8 $ 74.32 $67.30 24.0 $ 543.74 $ 454.82 Change 8.7% 10.4 19.6 (1) Selected Sales Defa does not include results for the legacy Interfine Brands business, now operating as a part of The Home Depot Pro, or, results for HD Supply Holdings, Inc. THE HOME DEPOT, INC. CONDENSED CONSOLIDATED BALANCE SHEETS (Unaudited) January 31, 2021 February 2, 2020 in millions Assets Current assets: Cash and cash equivalents Receivables, net Merchandise inventories Other current assets Total current assets Net property and equipment Operating lease right-of-use assets Goodwill Other assets Total assets 7.895 $ 2,992 16.627 963 28,477 24,705 5.962 7.126 4.311 70,581 $ 2.133 2,106 14.531 1.040 19.810 22,770 5,595 2.254 807 51,236 $ Liabilities and Stockholders' Equity Current liabilities: Short-term debt Accounts payable Accrued salaries and related expenses Current installments of long-term debt Current operating lease liabilities Other current liabilities Total current liabilities Long-term debt excluding current installments Long-term operating lease liabilities Other liabilities Total liabilities Total stockholders' equity (deficit) Total liabilities and stockholders' equity 11,606 2.463 1,416 828 6.853 23,166 35,822 5.356 2.938 67.282 3.299 70,581 974 7,787 1.494 1.839 828 5.453 18,375 28.670 5.066 2241 54,352 (3.116) 51,236 $ $ THE HOME DEPOT, INC. CONDENSED CONSOLIDATED STATEMENTS OF CASH FLOWS (Unaudited) Fiscal Year Ended January 31. February 2 in millions 2021 2020 Cash Flows from Operating Activities: Net earnings 12.866 $ 11.242 Reconciliation of net eamings to net cash provided by operating activities: Depreciation and amortization 2,519 2,296 Stock-based compensation expense 310 251 Changes in working capital 3.592 (488) Changes in deferred income taxes (569) 202 Other operating activities 121 184 Net cash provided by operating activities 18.839 13,687 Cash Flows from Investing Activities: Capital expenditures (2,463) (2,678) Payments for business acquired.net (7.780) Other investing activities 73 25 Net cash used in investing activities (10.170) (2,653) Cash Flows from Financing Activities: Repayments of short-term debt, net (974) (365) Proceeds from long-term debt, net of discounts and premium 7.933 3,420 Repayments of long-term debt (2,872 (1.070) Repurchases of common stock (791) (6.965) Proceeds from sales of common stock 326 280 Cash dividends (6.451) (5,958) Other financing activities (154) (140) Net cash used in financing activities (2.983 (10,798) Change in cash and cash equivalents 5,686 236 Effect of exchange rate changes on cash and cash equivalents 76 119 Cash and cash equivalents at beginning of year 2.133 1.778 Cash and cash equivalents at end of vear 7.895 $ 2,133 Note: Effective February 3, 2020, we reclassified cash flows relating to book overdrafts from financing to operating activities forat peneds presented on the Condensed Consolidated Statements of Cash Fows. The amounts of these reclassifications were not material Total Points: 100 Overview: Your case study looks Home Depot and Lowes, both retail home improvement companies. Answer all questions posed completely. Instructions: Refer to the financial statements of The Home Depot in Appendix A and Lowe's in Appendix B. For Home Depot what were the year-end dates for the "Fiscal 2020" and "Fiscal 2019" periods? Tn a 2007 Feb 3, 2019 2. For Home Depot which of the following are the amounts in the company's accounting equation (A = L + SE) for the 2020 fiscal year-end? For Home Depot what is the company's current ratio at February 2, 2020? 4. For Home Depot what does the company's current ratio in requirement 3 indicate? Use the two companies' fiscal 2020 balance sheets to determine the amounts in the accounting equation (A = L + SE). Is Lowe's or The Home Depot larger in terms of total assets? Does Lowe's have more or less current liabilities than The Home Depot at the end of fiscal 2020? Which company has a larger current ratio? On its fiscal 2020 year-end balance sheet, Lowe's reports inventory of $10,458,000,000. Does this amount represent the expected selling price? Why or & Has financing for Lowe's investment in assets primarily come from liabilities or stockholders' equity at the end of fiscal 2020? 9. For each company, calculate the percentage of total assets financed by total liabilities. 10. Thinking back to Chapter 1 does this imply Lowe's investors are taking on more, or less, risk than those investing in The Home Depot? why not? Instructions: Answer each question completely. Requirements: 614 Lowe's Companies, Inc. Consolidated Statements of Current and Retained Earnings (Unaudited) In Millions. Except Per Share and Percentage Data Three Months Ended Sit Month Ended July 31, 2020 August 2019 Jul 31, 2020 August 2, 2019 Current Earnings Amount % Sales Amount Sales Amount % Sales Amount % Sales Net sales $ 17,302 100.00 $ 20,992 100.00 $ 46,977 100,00 S 38.733 100.00 Cost of sales 17,995 65.92 14.252 67.89 31.162 26,412 68.19 Gross margin 9.304 34.08 6740 32.11 15.816 33.67 12321 31.81 Expenses Selling, general and administrative 5.030 18.39 4048 19.62 7.909 Depreciation and amortization 653 1.39 158 Operating income 3.959 2.381 11:34 5.9 12.66 2.795 9.81 Interest - net 219 0.80 169 0.80 0.90 331 0.86 Pre-tax earnings 3,738 13.69 2.212 1054 5595 11.76 8.95 Income tax provision 910 333 536 3.56 1.360 2.89 745 1.92 Net earning 2,828 10.36 5 1.476 7.98 S 4.165 3.87 $ 2.722 7.03 Weighted average common shares outstanding basic 752 781 754 TS Basic earning per common share $ 3.74 5 2.14 5 55 5344 Weighted average common sares outstanding diluted 753 781 735 789 Diluted earnings per common share $ 3.74 $ 2.14 S. $3.44 Cash dividenda per share $ 0.58 $ 0.55 5 1.10 5133 Retained Earnings Balance at beginning of period $ 1,722 $ 3.095 $ 1.727 $ 3.452 Cumulative effect of accounting change (263) Net earnings 2. 1.676 4168 2.722 Cash dividends declared (416) 031) (310) Share repurchase (1.904) Balance at end of period S 4.134 $ 2.439 S4134 $ 2.439 Under the two-class method, camins per share is calculated using net cumings allocable to come shares which is derived by reducing net earnings by the carings allocable to participating securities. Net earnings allocable to common shares used in the basic and diluted camnings per share calculation were 52.816 million for the three months ended July 31.030 and $1.670 million for the three months ended August 2, 2019. Net camings allocable to common shares wed in the basic and diluted cappershare calculation were 54.149 million for the six months ended July 31, 2020 and 3.713 million for the six months ended Aug 2.2019 Lowe's Companies, Inc. Consolidated Statements of Comprehensive Income (Unaudited) In Millions, Except Percentage Data Three Months Ended Six Months Ended July 31, 2020 August 2, 2019 July 31, 2020 August 2, 2019 Amount % Sales Amount Sales Ament Sales Amount % Sales Net earnings $ 2.25 10.36 5 1.676 7.98 S 4.165 3.87 5 2.722 7.03 Foreign currency translation adjustments net of tax 0.41 033 9.10) 36 Cash flow hedges - net oftar 5) 10.02) (105) 023) (16) 10:04) Other (1) 0.01 2 Other comprehensive income foss) 168 0.39 0.33 (149) 032) 22 6,05 Comprehensive income S 2.936 10.75 S 1,745 1 $ 4,016 3.55 $ 2.744 7.08 0:09 67 Lowe's Companies, Inc. Consolidated Balance Sheets (Unaudited) In Millions, Except Par Value Data July 31, 2020 August 2, 2019 January 31, 2020 716 Assets Current assets: Cash and cash equivalent Short-term investments Merchandise inventory --net Other current assets Total current assets Property, less accumulated depreciation Operating lease right-of-use assets Long-term investments Deferred income taxes-net Other assets Total assets 11.641 1,085 13.831 1.160 27,717 18.612 3,798 326 267 1,043 51.763 5 1,796 $ 275 13.730 995 16,796 18.203 3,967 179 160 13.179 1.261 15,318 18.669 3,891 372 512 216 1,038 40,695 s 1,005 39,471 Liabilities and shareholders' equity Current liabilities: Short-term borrowings Current matunities of long-term debt Current operating lease liabilities Accounts payable Accrued compensation and employee benefits Deferred revenue Other current liabilities Total current liabilities Long-term debt, excluding current maturities Noncurrent operating lease liabilities Deferred revenue-extended protection plans Other liabilities Total liabilities 1.000 609 520 12,916 1.139 1,715 3.471 21.370 20.197 3.859 981 1.000 47,407 1.009 492 9,499 717 1.324 2,794 15.835 16,538 4,055 868 759 38,055 1,941 597 501 7.659 684 1.219 2,581 15,182 16,768 3,943 894 712 37,499 388 381 Shareholders' equity: Preferred stock, SS par value: Authorized 50 million shares; Issued and outstanding-none Common stock, 80,50 par value: Authorized - 5.6 billion shares: Issued and outstanding - 756 million, 776 million, and 763 million shares respectively Capital in excess of par value Retained carings Accumulated other comprehensive loss Total shareholders' equity Total liabilities and shareholders' equity 378 129 4.134 (285) 4.356 51,763 2,439 (187) 2,640 40,695 1.727 (136) 1,972 Lowe's Companies, Inc. Consolidated Statements of Cash Flows (Unaudited) In Millions Six Months Ended July 31, 2020 August 2, 2019 4.1655 2.722 684 228 Cash flows from operating activities: Net earnings Adjustments to reconcile net earnings to net cash provided by operating activities: Depreciation and amortization Noncash lease expense Deferred income taxes Loss on property and other assets-net Share-based payment expense Changes in operating assets and liabilities Merchandise inventory-net Other operating assets Accounts payable Other operating liabilities Net cash provided by operating activities 747 214 (14) NO 64 (121) 38 51 (674) 66 5.259 1.825 11.752 (1.153) (104) 1.202 36 3.53 (1.132) 260 (710) 46 (24) (1.560) (245) 272 (526) 42 (1) (458) Cash flows from investing activities: Purchases of investments Proceeds from sale/maturity of investments Capital expenditures Proceeds from sale of property and other long-term assets Othernet Net cash used in investing activities Cash flows from financing activities: Net change in commercial paper Net proceeds from issuance of debt Repayment of long-term debe Proceeds from issuance of common stock under share-based payment plans Cash dividend payments Repurchase of common stock Othernet Net cash provided by (used in) financing activities Effect of exchange rate changes on cash Net increase in cash and cash equivalents, including cash classified within current assets held for sale Less: Net decrease in cash classified within current assets held for sale Net increase in cash and cash equivalents Casband cash equivalents, beginning of period Cash and cash equivalents, end of period (941) 3.961 (568) 83 (836) (966) (4) 729 (722) 2.972 (629) 72 (767) (2,770) (7) (1.851) (1) 10.925 1.273 10.925 716 12 1.285 511 1.796 Lowe's Companies, Inc. Non-GAAP Financial Measures Reconciliation (Unaudited) To provide additional transparency, the Company has presented the non-GAAP financial measure of adjusted diluted earnings per share for comparing its operating performance for the three months ended July 31, 2020, with the respective period ended August 2, 2019. This measure excludes the impact of certain discrete items, as further described below, not contemplated in Lowe's Original Business Outlook to assist analysts and investors in understanding operational performance for the second quarter of fiscal 2020 and fiscal 2019. Fiscal 2020 Impacts For fiscal 2020, the Company has recognized financial impacts from the following discrete item, not contemplated in the Company's Original Business Outlook for the second quarter of fiscal 2020: Beginning in the third quarter of fiscal 2019, the Company began a strategic review of its Canadian operations, and in the fourth quarter of fiscal 2019, the Company announced additional actions to improve future performance and profitability of its Canadian operations. As a result of this review and related actions, in the second quarter of fiscal 2020, the Company recognized $10 million of pre-tax operating costs related to remaining inventory write-downs and store closing costs (Canada restructuring) Eiscal 2019. Impacts During fiscal 2019, the Company recognized financial impacts from the following discrete item, not contemplated in the Company's Business Outlook for the second quarter of fiscal 2019: Prior to the beginning of fiscal 2019, the Company announced its intention to exit its Mexico retail operations and had planned to sell the operating business. During the three months ended August 2, 2019, the Company recognized a net loss of S12 million in pre-tax operating losses associated with the exit and ongoing wind-down of the Mexico retail operations (Mexico adjustments) Adjusted diluted carings per share should not be considered an alternative to, or more meaningful indicator of the Company's diluted camnings per share as prepared in accordance with GAAP. The Company's methods of determining non-GAAP financial measures may differ from the method used by other companies and may not be comparable. Detailed reconciliations between the Company's GAAP and non-GAAP financial results are shown below and available on the Company's website at www.lowes.com/investor, Three Months Ended (Unaudited) (Unaudited) July 31, 2020 August 2, 2019 Pre-Tax Net Pre-Tax (in millions, except per share data) Earnings Earnings Earnings Tax Earnings Diluted earnings per share, as reported 3.74 2.14 Non-GAAP adjustments per share impacts Canada restructuring 0.01 0.01 Mexico adjustments 0.02 (0.01) 0.01 Adjusted diluted earnings per share 3.75 s 2.15 Net Tax $ THE HOME DEPOT, INC. CONDENSED CONSOLIDATED STATEMENTS OF EARNINGS (Unaudited) Fiscal Year Ended January 31, February 2. % Change 2021 2020 25.1% $132.110 $110.225 25.7 87.257 72.653 240 44.853 37.572 Change 19.9% 20.1 19.4 28.5 8.1 26.5 20.0 24,447 2.128 26,575 18,278 19.740 1.989 21.729 15,843 23.8 7.0 223 15.4 Three Months Ended January 31, February 2 in millions, except per share data 2021 2020 Net sales $ 32,261 $ 25,782 Cost of sales 21.430 17.046 Gmee nmfit 10.831 8.736 Operating expenses: Sellina, general and administrative 6.187 4.814 Depreciation and amortization 561 519 Total operating expenses 6.748 5.333 Operating income 4,083 3,403 Interest and other (income)expense: Interest and investment income (10) (17) Interest expense 337 309 Interest and other net 327 292 Eaminas before provision for income taxes 3.756 3.111 Provision for income taxes 899 630 Net earnings $ 2.857 $ 2,481 Basic weighted average common shares 1.074 1.083 Basic eaminas per share $ 2.66 $ 2.29 Diluted weihted average common shares 1.078 1.088 Diluted eaminas per share $ 2.65 $ 2.28 1,128 (41.2) (47) (73) 9.1 1.347 1201 12.0 1,300 20.7 16.978 14.715 42.7 4.112 3.473 15.2% $ 12.866 $ 11.242 (35.6) 122 15.2 15.4 18.4 14.4% (0.81% 16.2 1.074 $11.98 1.093 $ 10.29 (1.71% 16.4 (0.9)% 1.078 1.097 16.2 $11.94 $ 10.25 (1.71% 16.5 Three Months Ended Fiscal Year Ended Selected Sales Data Customer transactinnelin millione) Average ticket Sales per retail square foot January 31, February 2 2021 2020 416.8 369.6 $ 75.69 $ 68.29 $ 528.01 S 425.70 January 31, February 2. Change 2021 2020 12.8% 1.756.3 1.616.0 10.8 $ 74.32 $67.30 24.0 $ 543.74 $ 454.82 Change 8.7% 10.4 19.6 (1) Selected Sales Defa does not include results for the legacy Interfine Brands business, now operating as a part of The Home Depot Pro, or, results for HD Supply Holdings, Inc. THE HOME DEPOT, INC. CONDENSED CONSOLIDATED BALANCE SHEETS (Unaudited) January 31, 2021 February 2, 2020 in millions Assets Current assets: Cash and cash equivalents Receivables, net Merchandise inventories Other current assets Total current assets Net property and equipment Operating lease right-of-use assets Goodwill Other assets Total assets 7.895 $ 2,992 16.627 963 28,477 24,705 5.962 7.126 4.311 70,581 $ 2.133 2,106 14.531 1.040 19.810 22,770 5,595 2.254 807 51,236 $ Liabilities and Stockholders' Equity Current liabilities: Short-term debt Accounts payable Accrued salaries and related expenses Current installments of long-term debt Current operating lease liabilities Other current liabilities Total current liabilities Long-term debt excluding current installments Long-term operating lease liabilities Other liabilities Total liabilities Total stockholders' equity (deficit) Total liabilities and stockholders' equity 11,606 2.463 1,416 828 6.853 23,166 35,822 5.356 2.938 67.282 3.299 70,581 974 7,787 1.494 1.839 828 5.453 18,375 28.670 5.066 2241 54,352 (3.116) 51,236 $ $ THE HOME DEPOT, INC. CONDENSED CONSOLIDATED STATEMENTS OF CASH FLOWS (Unaudited) Fiscal Year Ended January 31. February 2 in millions 2021 2020 Cash Flows from Operating Activities: Net earnings 12.866 $ 11.242 Reconciliation of net eamings to net cash provided by operating activities: Depreciation and amortization 2,519 2,296 Stock-based compensation expense 310 251 Changes in working capital 3.592 (488) Changes in deferred income taxes (569) 202 Other operating activities 121 184 Net cash provided by operating activities 18.839 13,687 Cash Flows from Investing Activities: Capital expenditures (2,463) (2,678) Payments for business acquired.net (7.780) Other investing activities 73 25 Net cash used in investing activities (10.170) (2,653) Cash Flows from Financing Activities: Repayments of short-term debt, net (974) (365) Proceeds from long-term debt, net of discounts and premium 7.933 3,420 Repayments of long-term debt (2,872 (1.070) Repurchases of common stock (791) (6.965) Proceeds from sales of common stock 326 280 Cash dividends (6.451) (5,958) Other financing activities (154) (140) Net cash used in financing activities (2.983 (10,798) Change in cash and cash equivalents 5,686 236 Effect of exchange rate changes on cash and cash equivalents 76 119 Cash and cash equivalents at beginning of year 2.133 1.778 Cash and cash equivalents at end of vear 7.895 $ 2,133 Note: Effective February 3, 2020, we reclassified cash flows relating to book overdrafts from financing to operating activities forat peneds presented on the Condensed Consolidated Statements of Cash Fows. The amounts of these reclassifications were not material
Step by Step Solution
There are 3 Steps involved in it

Get step-by-step solutions from verified subject matter experts