

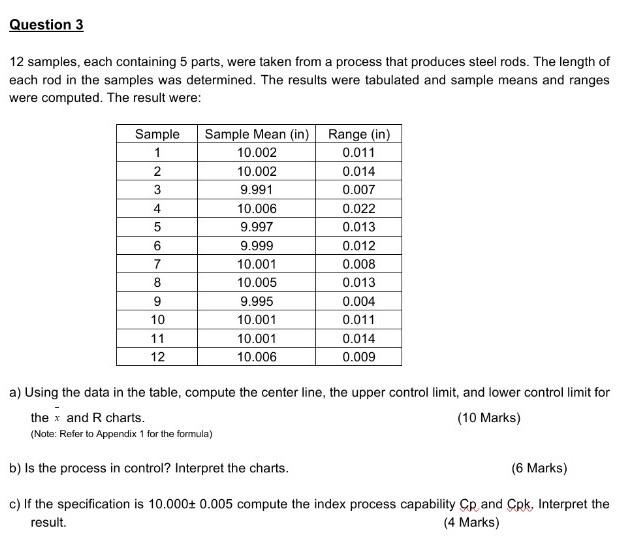
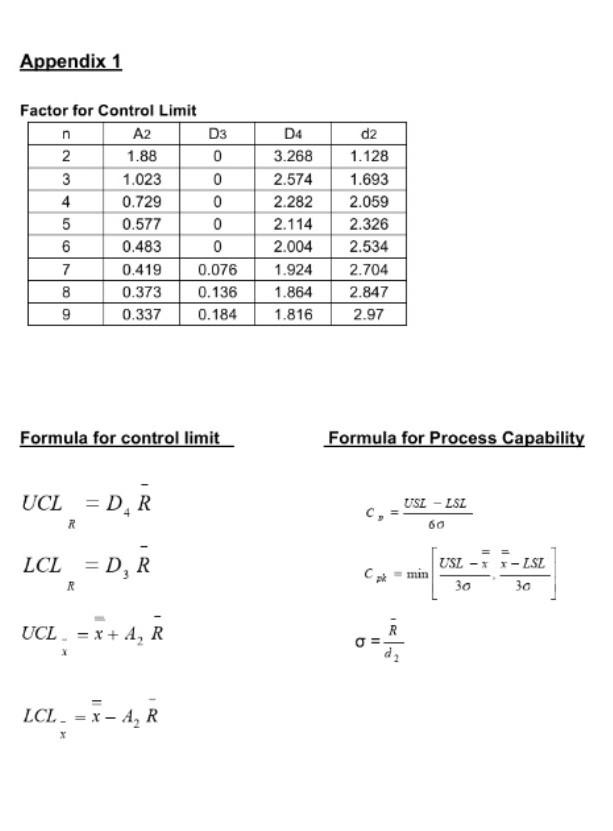
Question: Total Quality Management Question Question 3 12 samples, each containing 5 parts, were taken from a process that produces steel rods. The length of each
Total Quality Management Question
Question 3 12 samples, each containing 5 parts, were taken from a process that produces steel rods. The length of each rod in the samples was determined. The results were tabulated and sample means and ranges were computed. The result were: Sample 1 2 3 4 5 6 7 8 9 10 11 12 Sample Mean (in) Range (in) 0.011 0.014 0.007 0.022 0.013 10.002 10.002 9.991 10.006 9.997 9.999 10.001 10.005 9.995 10.001 10.001 10.006 0.012 0.008 0.013 0.004 0.011 0.014 0.009 a) Using the data in the table, compute the center line, the upper control limit, and lower control limit for the x and R charts. (10 Marks) (Note: Refer to Appendix 1 for the formula) b) Is the process in control? Interpret the charts. (6 Marks) c) If the specification is 10.000+ 0.005 compute the index process capability Cp and Cpk. Interpret the result. (4 Marks) Appendix 1 Factor for Control Limit A2 1.88 1.023 0.729 0.577 0.483 0.419 0.076 0.373 0.136 0.337 0.184 2 3 4 5 6 7 8 9 00 UCL = D. R R LCL = D, R R Formula for control limit UCL = x + A R D3 0 LCL = X-A R X 0 0 0 0 D4 3.268 2.574 2.282 2.114 2.004 1.924 1.864 1.816 d2 1.128 1.693 2.059 2.326 2.534 2.704 2.847 2.97 Formula for Process Capability C, Cpk b 11 R USL LSL 60 USLxx-LSL 30 30Step by Step Solution
There are 3 Steps involved in it
1 Expert Approved Answer
Step: 1 Unlock

Question Has Been Solved by an Expert!
Get step-by-step solutions from verified subject matter experts
Step: 2 Unlock
Step: 3 Unlock