

Question: #4) (25 points) Business models contain value proposition for customers as well as value proposition for the company. Hence, the concept of value is central
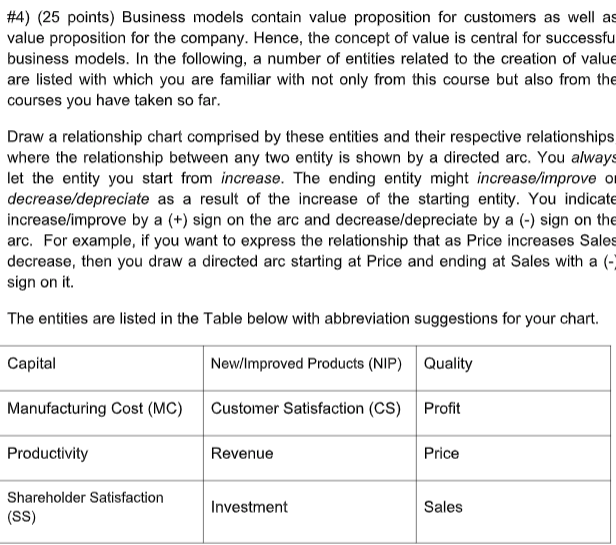
#4) (25 points) Business models contain value proposition for customers as well as value proposition for the company. Hence, the concept of value is central for successfu business models. In the following, a number of entities related to the creation of value are listed with which you are familiar with not only from this course but also from the courses you have taken so far. Draw a relationship chart comprised by these entities and their respective relationships where the relationship between any two entity is shown by a directed arc. You always let the entity you start from increase. The ending entity might increase/improve o decrease/depreciate as a result of the increase of the starting entity. You indicate increase/improve by a (+) sign on the arc and decrease/depreciate by a (-) sign on the arc. For example, if you want to express the relationship that as Price increases Sales decrease, then you draw a directed arc starting at Price and ending at Sales with a (- sign on it. The entities are listed in the Table below with abbreviation suggestions for your chart. Capital New/Improved Products (NIP) Quality Manufacturing Cost (MC) Customer Satisfaction (CS) Profit Productivity Revenue Price Shareholder Satisfaction (SS) Investment Sales #4) (25 points) Business models contain value proposition for customers as well as value proposition for the company. Hence, the concept of value is central for successfu business models. In the following, a number of entities related to the creation of value are listed with which you are familiar with not only from this course but also from the courses you have taken so far. Draw a relationship chart comprised by these entities and their respective relationships where the relationship between any two entity is shown by a directed arc. You always let the entity you start from increase. The ending entity might increase/improve o decrease/depreciate as a result of the increase of the starting entity. You indicate increase/improve by a (+) sign on the arc and decrease/depreciate by a (-) sign on the arc. For example, if you want to express the relationship that as Price increases Sales decrease, then you draw a directed arc starting at Price and ending at Sales with a (- sign on it. The entities are listed in the Table below with abbreviation suggestions for your chart. Capital New/Improved Products (NIP) Quality Manufacturing Cost (MC) Customer Satisfaction (CS) Profit Productivity Revenue Price Shareholder Satisfaction (SS) Investment Sales
Step by Step Solution
There are 3 Steps involved in it

Get step-by-step solutions from verified subject matter experts