

Question: 7. Using the data below, compute the warning limits and corrective action limits, which are 2 and 3 standard deviations, respectively. The process standard deviation,
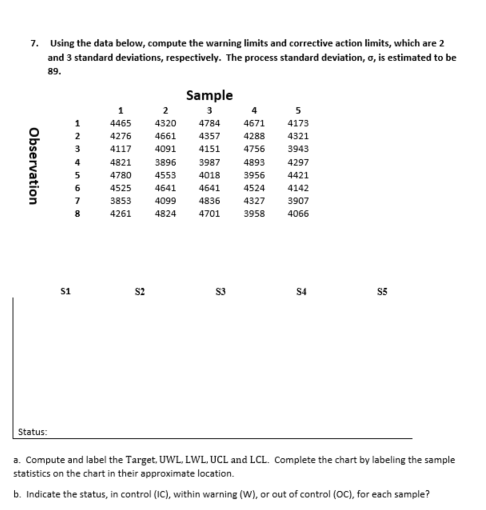
7. Using the data below, compute the warning limits and corrective action limits, which are 2 and 3 standard deviations, respectively. The process standard deviation, , is estimated to be 89. a. Compute and label the Target, UWL, LWL, UCL and LCL. Complete the chart by labeling the sample statistics on the chart in their approximate location. b. Indicate the status, in control (IC), within warning (W), or out of control (OC), for each sample
Step by Step Solution
There are 3 Steps involved in it
1 Expert Approved Answer
Step: 1 Unlock

Question Has Been Solved by an Expert!
Get step-by-step solutions from verified subject matter experts
Step: 2 Unlock
Step: 3 Unlock