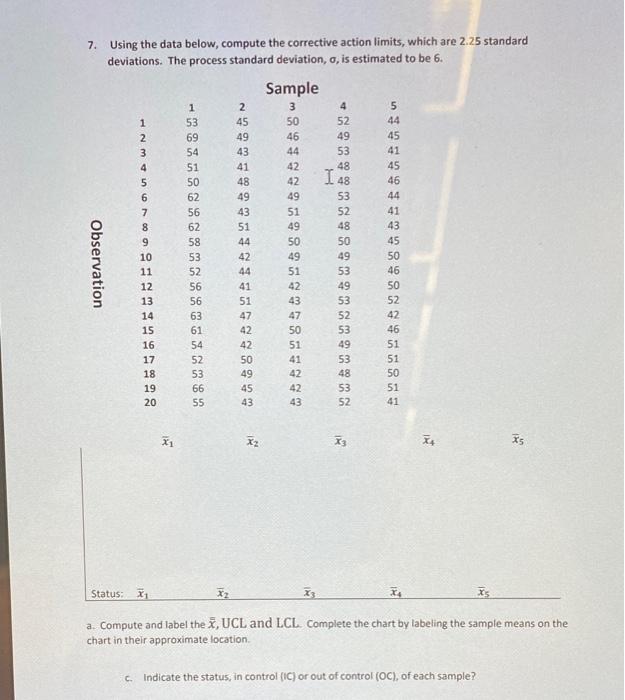
Question: 7. Using the data below, compute the corrective action limits, which are 2.25 standard deviations. The process standard deviation, , is estimated to be 6

7. Using the data below, compute the corrective
7. Using the data below, compute the corrective action limits, which are 2.25 standard deviations. The process standard deviation, , is estimated to be 6 . x1x2x3x4x5 Status: x1 x2x3x4x5 a. Compute and label the x, UCL and LCL. Complete the chart by labeling the sample means on the chart in their approximate location. c. Indicate the status, in control (IC) or out of control (OC), of each sample

Step by Step Solution

There are 3 Steps involved in it

1 Expert Approved Answer
Step: 1 Unlock blur-text-image
Question Has Been Solved by an Expert!

Get step-by-step solutions from verified subject matter experts

Step: 2 Unlock
Step: 3 Unlock

Students Have Also Explored These Related General Management Questions!