

Question: BTN 12-3 Access the April 14, 2016, filing of the 10-K report (for year ending December 31, 2015) of Mendocino Brewing Company, Inc. (ticker: MENB)
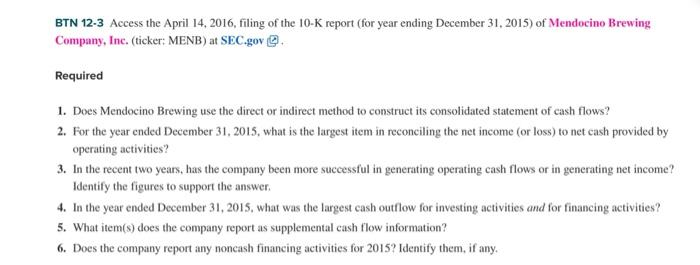
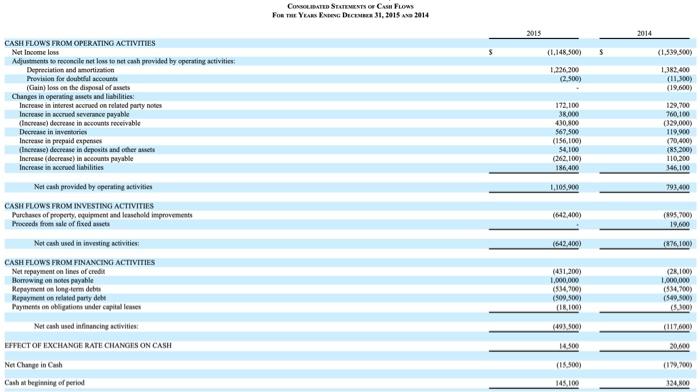
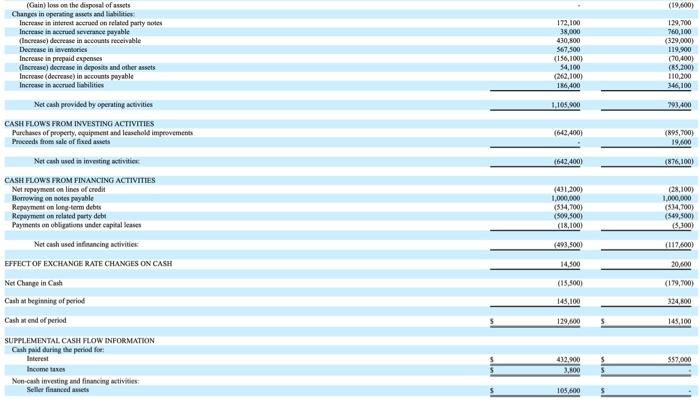
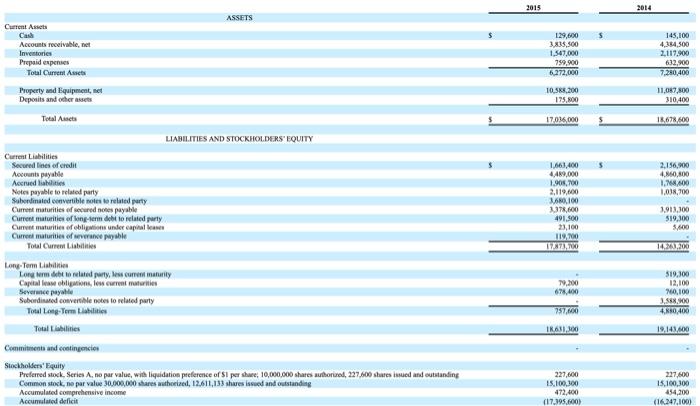
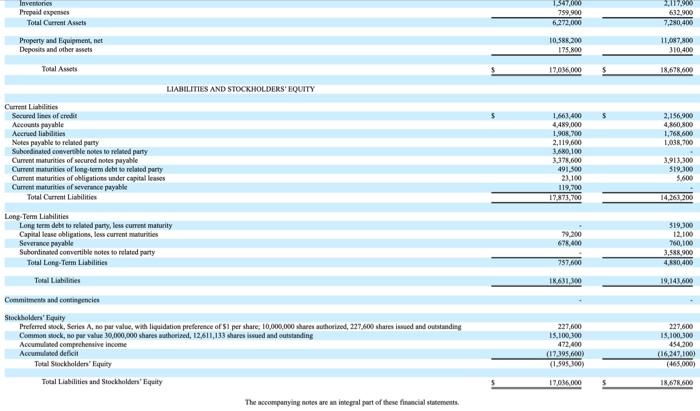
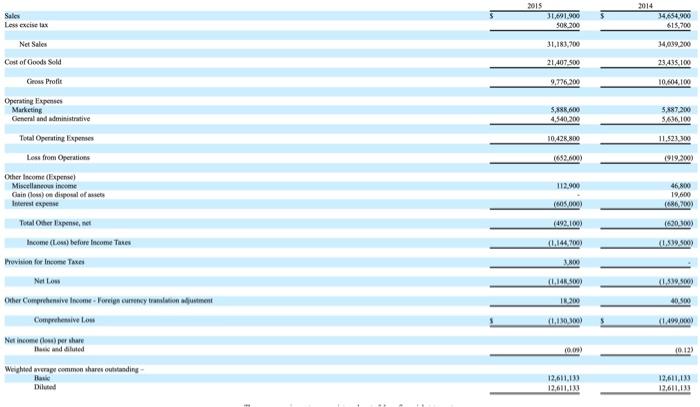
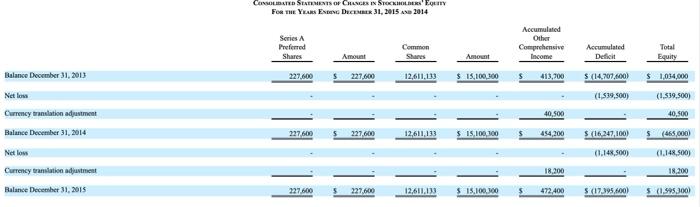
BTN 12-3 Access the April 14, 2016, filing of the 10-K report (for year ending December 31, 2015) of Mendocino Brewing Company, Inc. (ticker: MENB) at SEC.gov. Required 1. Does Mendocino Brewing use the direct or indirect method to construct its consolidated statement of cash flows? 2. For the year ended December 31, 2015, what is the largest item in reconciling the net income (or loss) to net cash provided by operating activities? 3. In the recent two years, has the company been more successful in generating operating cash flows or in generating net income? Identify the figures to support the answer 4. In the year ended December 31, 2015, what was the largest cash outflow for investing activities and for financing activities? 5. What item(s) does the company report as supplemental cash flow information? 6. Does the company report any noncash financing activities for 2015? Identify them, if any. CONSOLIDATED STATEMENTS OF CASH FLOW FOR THE YEAR END DEC 31, 2015 2014 2015 2014 (1,339,300) 1.226.200 (2.500) 1.162.400 (11,300) (19.600) CASH FLOWS FROM OPERATING ACTIVITIES Net Income loss Adjustments to reconcile net loss to notah provided by operating activities Depreciation and amortization Provision for doubdial accounts (Guin) less on the disposal of assets Changes in operating assets and abilities: Increase in interest accrued on related party notes Increase in accred severe payable (Increase) decrease in accounts receivable Decrease in inventories Increase in prepaid expenses Increase) decrease in deposits and other net Increase (decrease in accounts payable Increase in red liabilities Nel cash provided by operating activities 172.100 38.000 430.800 567.500 (156,100) 54,100 (262.100) 186,400 129,700 760,100 (329,000) 119.900 (70.400) 185,200) 110.200 346.100 1,105,900 793.400 (642.400) (895,700) 19.000 (642.400) (87,1003 CASH FLOWS FROM INVESTING ACTIVITIES Purchases of property, uipment and leasehold improvements Proceeds from sale of fixed Net cash used in investing activities CASH FLOWS FROM FINANCING ACTIVITIES Net repayment on line of credit Borrowing on notes payable Repayment on long-term det Repayment on related party dele Payments on obligation under capitales Net cash used infinancing activities: EFFECT OF EXCHANGE RATE CHANGES ON CASH Net Change in Cash Cash beginning of period (431,200) 1,000,000 (534,00) (509,500 (1100) (28.100) 1,000,000 (534.700) (549.500) (100 (493 800) (117,600) 14.500 20.000 (15.500) (179.000 145.100 324,00 (19.600) 172,100 38,000 430,500 567,500 (156,100) 54,100 (262,100) 186,400 129,700 760,100 (329,000) 119.900 (70,400) 185,200) 110,200 346,100 1.105.900 293.400 (Gain) loss on the disposal of assets Changes in operating assets and bites Increase in interest accrued on related party notes Increase in sred severance payable (Recrease) decrease in accounts receivable Decrease in avtories Increase in prepaid expenses increase) decrease in deposits and other assets Increase (decrease) in accounts payable Increase in accrued abilities Net cash provided by operating activities CASH FLOWS FROM INVESTING ACTIVITIES Purchases of property, equipment and lesschold improvements Proceeds from sale of fixed its Net cash used in investing activities CASH FLOWS FROM FINANCING ACTIVITIES Net repayment on lines of credit Borrowing on botes payable Repayment on long-term debts Repayment on related party debt Payments on obligations under capital lesen Net cash used infancing activities (642.400) (895,700) 19.000 (642,400) (876,100) ($1,200) 1,000,000 (534,700) (509.500) (18,100) (28,100) 1,000,000 (534,700) (549,500) 5,300) (291 (119.0001 EFFECT OF EXCHANGE RATE CHANGES ON CASH 14.500 20,000 (15,500) (179,700) 145.100 324,800 129,600 145,100 Net Change in Cash Cash at beginning of period Cash at end of period SUPPLEMENTAL CASH FLOW INFORMATION Cash paid during the period for interest Income Non-cash investing and financing wivitis Seller financed $57,000 432,900 3.800 105,600 2015 2014 ASSETS Current Assets Cash Accounts receivable, niet Inventories Prepaid experies Total Current Asset Property and Equipment, et Deposits and there Total Assets 129,60 3,835,500 1,547.000 799,000 6.272.000 145,100 4,364,500 2,117,900 632,900 7.280,400 10.585,200 175,000 11.047,800 310,400 17.035,000 18,678,600 2,156,00 4.190,00 1,768.800 1,01%, 700 LIABILITIES AND STOCKHOLDERS' EQUITY Current Liabilities Secured lines of credit Accounts payable Accredibilities Notes payable to related party Subordinated convertible notes de related party Current maturities of secured notes payable Currematorities of long-term done to related party Curret maturities of oblig under capital ans Current maturities of repable Toul Current Liabilities Long Term List Lorem dit to related party, le current maturity Capital la obligation, low current materie Sevence payable Subordinated convertible notes to related party Total Long Term Lilities Total abilities 1.661,400 4,489,000 1.908700 2,119.000 3.680.100 337,600 491,500 23,100 119,700 INO 1.913.100 519,300 3.600 14.2.200 19,200 519.100 12,100 10,100 J.SEX,100 4.610,400 757.100 10.631,300 19.141,600 Commitment and contingencies Stockholders' Equity Preferred stock Series A. ne par value, with liquidation preference of S1 per share 10,000,000 shares authorired, 227.600 shares issued and outstanding Common stock. ne par value 30,000,000 shares theted, 12.611,133 shares issued and outstanding Accumulated comprehensive income Accumulated delicit 227,600 15.100.300 472,400 (17.395.600) 227,600 15,100,100 454,200 (16.247.100) Inventories Prepaid expenses Total Current Assets 1.56700 799,900 6.272.000 2,117.900 632.900 7,280,400 Property and Equipment, net Deports and other assets 10,586.200 175,00 11.087.800 310.400 Total Assets 17,016,000 18,678,600 LIABILITIES AND STOCKHOLDERS' EQUITY 2,156,900 4,850.800 1,768,600 1.038.700 Current Liais Secured lines of credit Accounts payable Accrued liabilities Notes payable to related party Subordinated convertible not to rewed party Current matunities of secured notes payable Current maturities of long-term debt to related party Current maturities of obligations under capital lases Current maturities of severance payable Total Current Liabilities 1.663.400 4,489,000 1.908,700 2.119.600 3.680,100 3.375.000 491.500 23.100 119.700 17.873,700 3,913,300 $19,300 5.600 14,263200 79.200 67.400 Long-Term Liabilities Long term debe to related party less current maturity Capital lease obligations, less current maturities Severance payable Subordinated convertible notes to related party Total Long-Term Liabilities Total Liabilities 319,100 12.100 760,100 3,588.900 4,830,400 757.100 18,631,300 19,143,600 Commitment and contingencies Stockholders' Equity Preferred stock, Serie A, no par value with liquidation preference of 51 per share. 10,000,000 shares authorized, 227,600 shares issued and outstanding Common stock, to per vale 30,000,000 shares with red, 12/611,133 shares issued and outstanding Accued comprehensive Income Acom deficit Total Stockholders' Fiquity Total Liabilities and Stockholden Equity 227,600 15.100,300 472,400 (17.395.600) (1.595.300) 227.600 15,100,300 454200 (16,247.100) (465.000) 17.036.000 18.67.600 The companying notes are integral part of these financial statements 2015 Sales Less excise tax 31.691.900 S08.200 2014 34,654,900 615,700 Net Sales 31,183,700 34,999-200 Cost of Goods Sold 21,407 500 20.415100 Gross Profit 9,776.200 10,104,100 Operating Expenses Marketing General and administrative 5.88.600 4,5-40.200 5,887,200 $636,100 Total Operating Expenses 10,420.00 11,521100 Less from Operations 1652.00) 1919.2003 112.900 46.800 19,600 (186.2009 (492.100) 1620.00) 0.144200 1,509 500) Other Income (Expense Miscellaneous income Gain (la) on disposal of niet Interest expertise Total herpen, Income (om tefe fncome Tunes Provision for Income Taxe Net Low Other Comprehensive Income - Foreley rationen Comprehensive Net income operare 300 (L.14.00 1.530.00 TR200 1000 1100) (0.123 Weighted a common shares outstanding 12,611.130 12,6111 12,611,129 12,611,133 Dilud CONSOLIDATED STATEMENTS CHANGE IN STEKKERSEY For me. You Extex DeCEMBER 31, 2015 2014 Serie A Preferred Shares Accumulated Other Comprehensive Income Common Shares Amount Amount Accumulated Deficit Total Equity Balance December 31, 2013 227.600 $221.600 12,611,133 $ 15,100,300 413.700 S (14.707.00) $ 1,034,000 (1.539,500) (1.599,500) Netlom Currency translation adjustment Balance December 31, 2014 40,500 40,500 227600 227 600 12,611,133 S IS 100 100 454,200 $ (16.247,100) (465.000) (1.148,500) (1.148,500) Netlom Currency translation adjustment Balance December 31, 2015 18,200 18,200 227,600 5 227,600 12,611,132 $ 15,100,100 472,400 5 (17.395,600) 5 (1.595,3001
Step by Step Solution
There are 3 Steps involved in it

Get step-by-step solutions from verified subject matter experts