

Question: E13-1 (Algo) Preparing and Interpreting a Schedule for Horizontal and Vertical Analyses [LO 13-2, 13-3, 13-5) The average price of a gallon of gas in


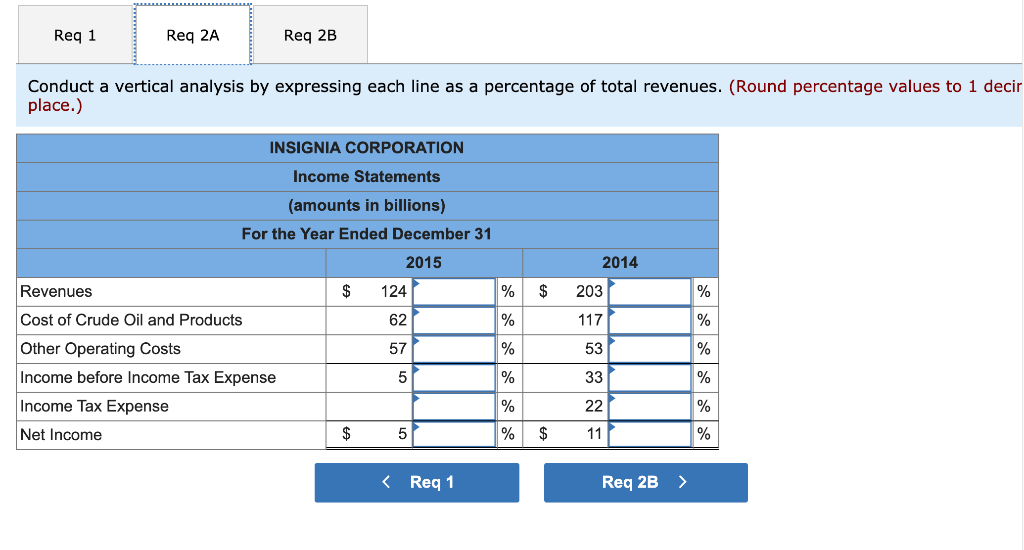
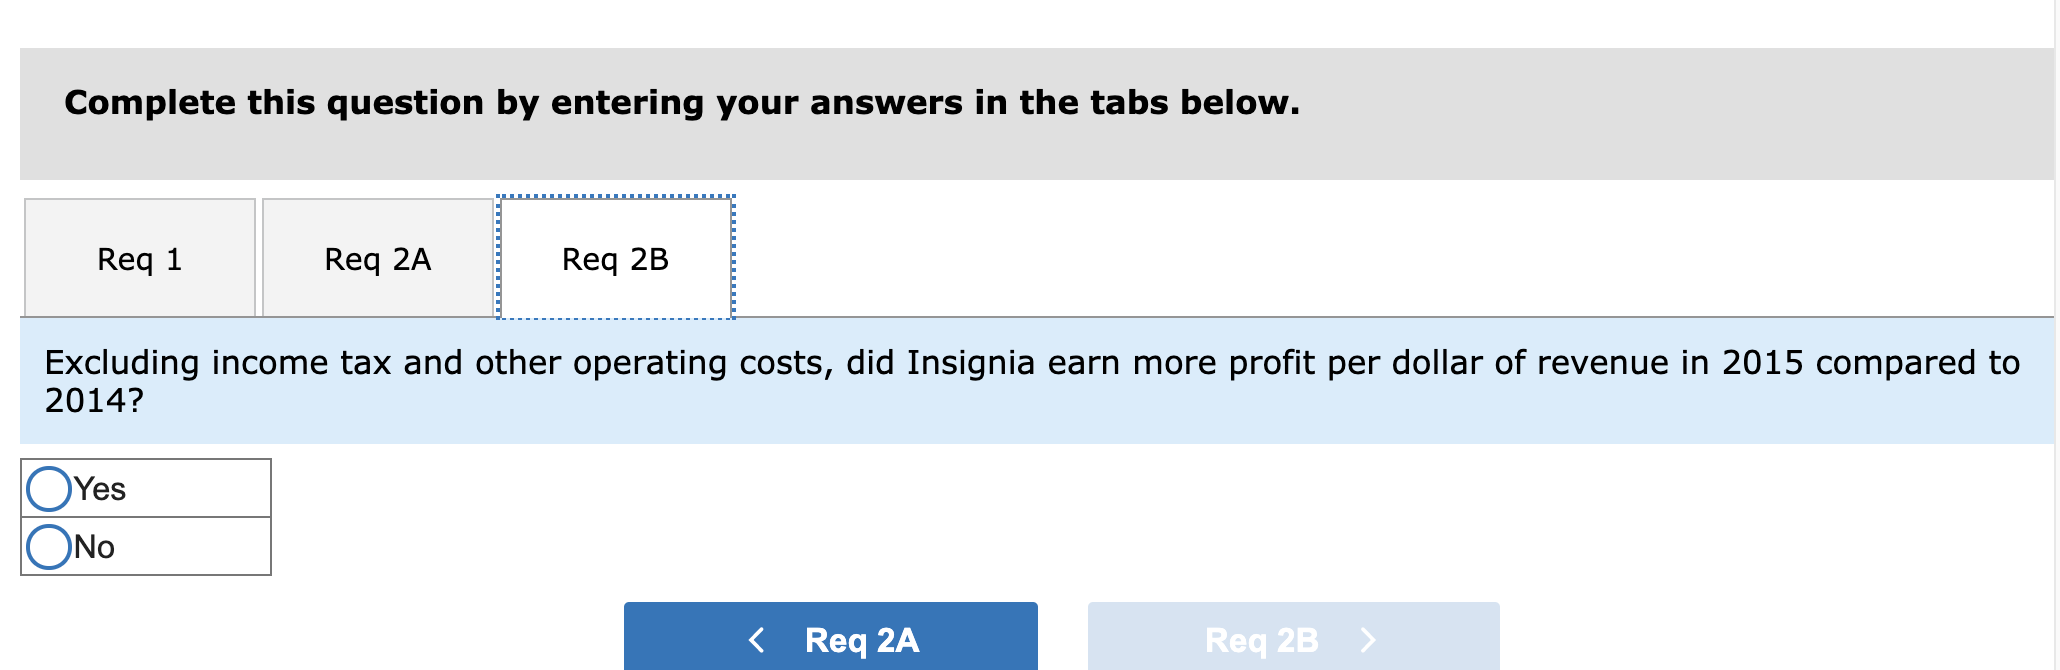
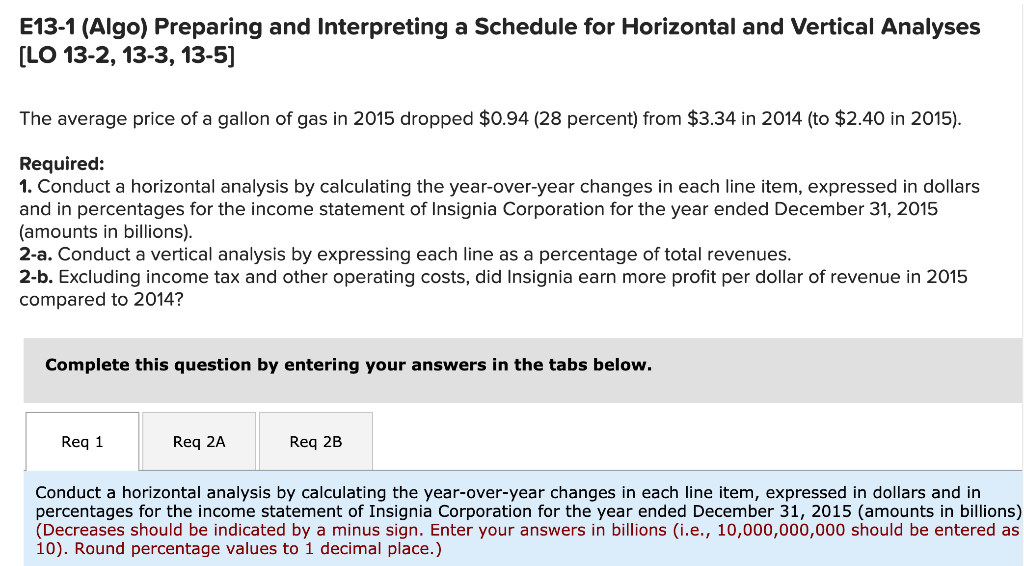
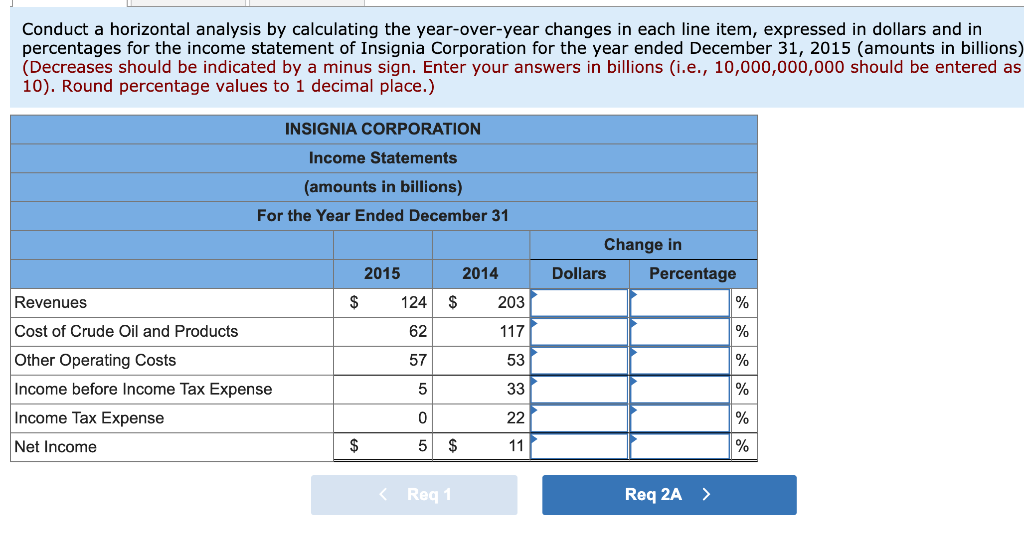


E13-1 (Algo) Preparing and Interpreting a Schedule for Horizontal and Vertical Analyses [LO 13-2, 13-3, 13-5) The average price of a gallon of gas in 2015 dropped $0.94 (28 percent) from $3.34 in 2014 (to $2.40 in 2015). Required: 1. Conduct a horizontal analysis by calculating the year-over-year changes in each line item, expressed in dollars and in percentages for the income statement of Insignia Corporation for the year ended December 31, 2015 (amounts in billions). 2-a. Conduct a vertical analysis by expressing each line as a percentage of total revenues. 2-b. Excluding income tax and other operating costs, did Insignia earn more profit per dollar of revenue in 2015 compared to 2014? Complete this question by entering your answers in the tabs below. Req 1 Req 2A Req 2B Conduct a horizontal analysis by calculating the year-over-year changes in each line item, expressed in dollars and in percentages for the income statement of Insignia Corporation for the year ended December 31, 2015 (amounts in billions) (Decreases should be indicated by a minus sign. Enter your answers in billions (i.e., 10,000,000,000 should be entered as 10). Round percentage values to 1 decimal place.) Conduct a horizontal analysis by calculating the year-over-year changes in each line item, expressed in dollars and in percentages for the income statement of Insignia Corporation for the year ended December 31, 2015 (amounts in billions) (Decreases should be indicated by a minus sign. Enter your answers in billions (i.e., 10,000,000,000 should be entered as 10). Round percentage values to 1 decimal place.) INSIGNIA CORPORATION Income Statements (amounts in billions) For the Year Ended December 31 Change in Dollars Percentage 2015 2014 Revenues $ 124 $ 203 % 62 117 % 57 53 % Cost of Crude Oil and Products Other Operating Costs Income before Income Tax Expense Income Tax Expense 5 33 % 0 22 % Net Income $ 5 $ 11 % Req 1 Req 2A Req 2B Conduct a vertical analysis by expressing each line as a percentage of total revenues. (Round percentage values to 1 decir place.) INSIGNIA CORPORATION Income Statements (amounts in billions) For the Year Ended December 31 2015 2014 Revenues $ 124 % $ 203 % 62 % 117 % 57 % 53 % Cost of Crude Oil and Products Other Operating Costs Income before Income Tax Expense Income Tax Expense Net Income 5 33 % % % % 22 % $ 5 $ 11 %
Step by Step Solution
There are 3 Steps involved in it

Get step-by-step solutions from verified subject matter experts