

Question: Presented below is the comparative balance sheet for Sheridan Company Sheridan Company Comparative Balance Sheet As of December 31, 2021 and 2020 December 31 2021
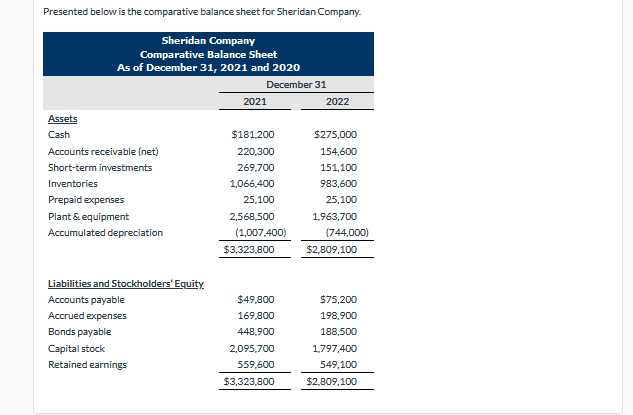
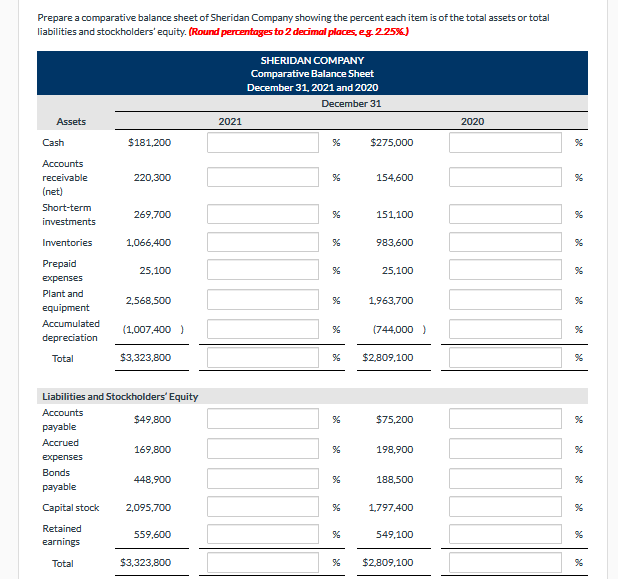
Presented below is the comparative balance sheet for Sheridan Company Sheridan Company Comparative Balance Sheet As of December 31, 2021 and 2020 December 31 2021 2022 Assets Cash $181 200 $275,000 Accounts receivable (net) 220,300 154,600 Short-term investments 269,700 151,100 Inventories 1,066,400 983,600 Prepaid expenses 25,100 25,100 Plant & equipment 2.568,500 1,963,700 Accumulated depreciation (1,007,400) (744,000) $3,323,800 $2.809,100 $49.800 Liabilities and Stockholders' Equity Accounts payable Accrued expenses Bonds payable Capital stock Retained earnings 169,800 448,900 2,095,700 559,600 $3,323,800 $75,200 198.900 188,500 1,797.400 549.100 $2,809,100 Prepare a comparative balance sheet of Sheridan Company showing the percent each item is of the total assets or total liabilities and stockholders' equity. (Round percentages to 2 decimal places.eg 225%) SHERIDAN COMPANY Comparative Balance Sheet December 31, 2021 and 2020 December 31 2021 Assets 2020 Cash $181,200 56 $275,000 220,300 56 154,600 Accounts receivable (net) Short-term investments 269,700 151,100 Inventories 1,066,400 983,600 25.100 25,100 Prepaid expenses Plant and equipment Accumulated depreciation 2,568,500 1,963,700 (1,007,400) (744,000) Total $3,323,800 56 $2,809,100 $75,200 % Liabilities and Stockholders' Equity Accounts $49,800 payable Accrued 169,800 expenses Bonds 448,900 payable Capital stock 2,095,700 198,900 188,500 56 1.797,400 % Retained earnings 559,600 549,100 % Total $3,323,800 $2,809,100
Step by Step Solution
There are 3 Steps involved in it

Get step-by-step solutions from verified subject matter experts