

Question: Sales (in S) for one week were collected for 18 stores in a food store chain. The data are shown below. The stores and towns
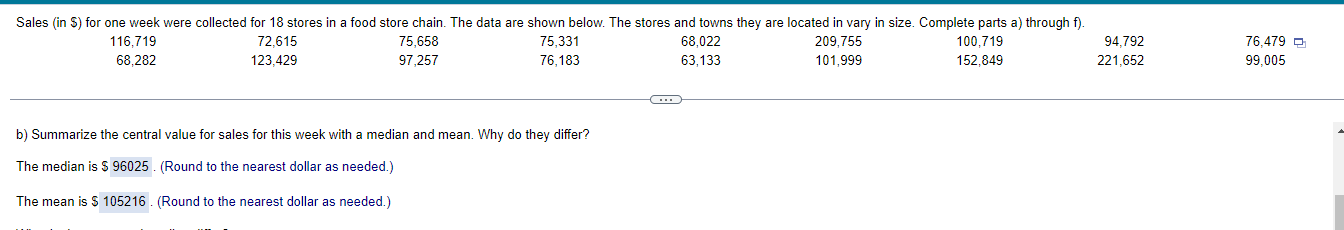

Sales (in S) for one week were collected for 18 stores in a food store chain. The data are shown below. The stores and towns they are located in vary in size. Complete parts a) through f). 94,792 116,719 68,282 72,615 123,429 75,658 97,257 75,331 76,183 68,022 63,133 209,755 101,999 100,719 152,849 221,652 -C... b) Summarize the central value for sales for this week with a median and mean. Why do they differ? The median is $ 96025. (Round to the nearest dollar as needed.) The mean is $ 105216. (Round to the nearest dollar as needed.) 76.479 99,005 d) Summarize the spread of the sales distribution with a standard deviation and with an IQR. The standard deviation of the distribution is $ (Round to the nearest dollar as needed.)
Step by Step Solution
There are 3 Steps involved in it

Get step-by-step solutions from verified subject matter experts