

Question: sting and Estimating Share Value Using the DCF Model Following are the income statement and balance sheet for Intel Corporation. INTEL CORPORATION Consolidated Statements of

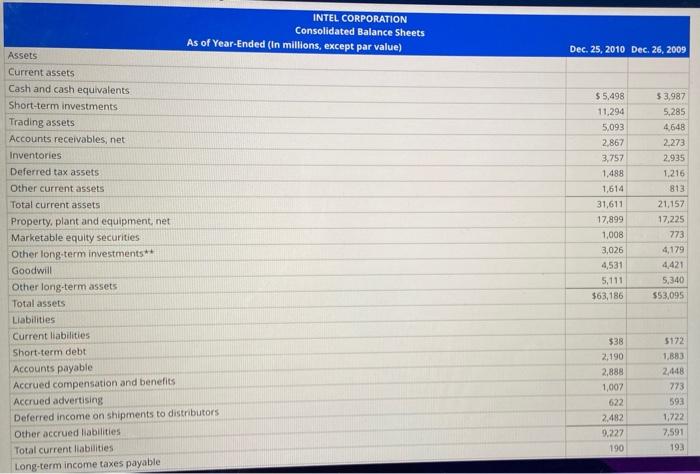


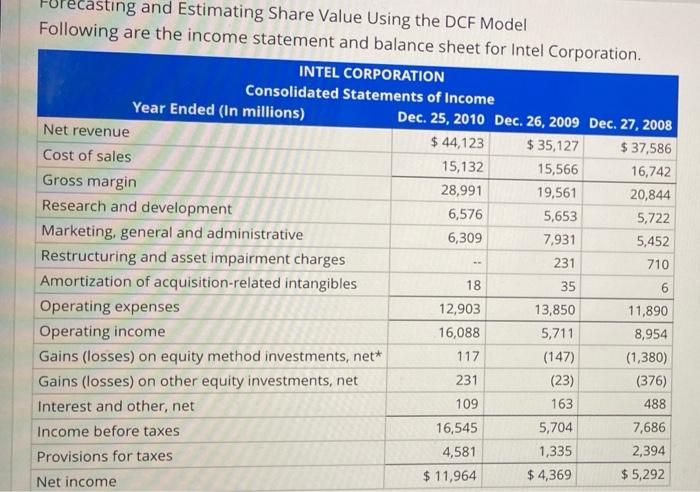

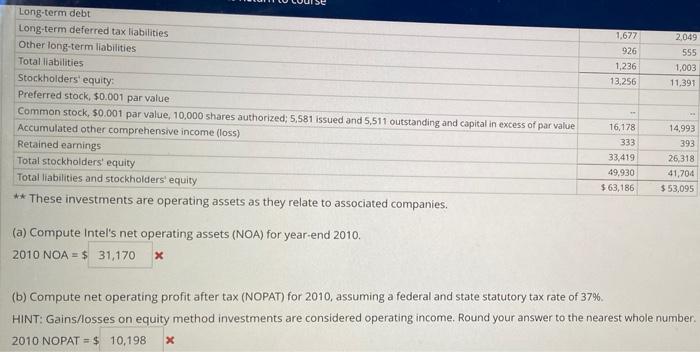

sting and Estimating Share Value Using the DCF Model Following are the income statement and balance sheet for Intel Corporation. INTEL CORPORATION Consolidated Statements of Income Year Ended (In millions) Dec. 25, 2010 Dec. 26, 2009 Dec. 27, 2008 Net revenue $44,123 $ 35,127 $ 37,586 Cost of sales 15,132 15,566 16,742 Gross margin 28,991 19,561 20,844 6,576 5,653 5,722 Research and development Marketing, general and administrative 6,309 7,931 5,452 231 710 Restructuring and asset impairment charges Amortization of acquisition-related intangibles 18 35 6 Operating expenses 12,903 13,850 11,890 16,088 5,711 Operating income 8,954 117 (147) (1,380) Gains (losses) on equity method investments, net* Gains (losses) on other equity investments, net 231 (23) (376) 109 163 488 Interest and other, net 16,545 5,704 7,686 Income before taxes 4,581 1,335 2,394 Provisions for taxes $ 11,964 $ 4,369 $5,292 Net income INTEL CORPORATION Consolidated Balance Sheets As of Year-Ended (In millions, except par value) Assets Current assets Cash and cash equivalents Short-term investments Trading assets Accounts receivables, net Inventories Deferred tax assets. Other current assets Total current assets Property, plant and equipment, net Marketable equity securities Other long-term investments** Goodwill Other long-term assets Total assets Liabilities Current liabilities Short-term debt Accounts payable Accrued compensation and benefits Accrued advertising Deferred income on shipments to distributors Other accrued liabilities Total current liabilities Long-term income taxes payable Dec. 25, 2010 Dec. 26, 2009 $5,498 $3,987 11,294 5,285 5,093 4,648 2,867 2,273 3,757 2,935 1,488 1,216 1,614 31,611 17,899 1,008 3,026 4,531 5,111 $63,186 $38 2,190 2,888 1,007 622 2,482 9,227 190 813- 21,157 17,225 773 4,179 4,421 5,340 $53,095 $172 1,883 2,448 773 593 1,722 7,591 193. Long-term debt 1,677 2,049 Long-term deferred tax liabilities Other long-term liabilities 926 555 1,236 Total liabilities 1,003 13,256 11,391 Stockholders' equity: Preferred stock, $0.001 par value ww Common stock, $0.001 par value, 10,000 shares authorized; 5,581 issued and 5,511 outstanding and capital in excess of par value Accumulated other comprehensive income (loss) 16,178 14,993 333 393 Retained earnings 33,419 26,318 Total stockholders' equity 49,930 41,704 Total liabilities and stockholders' equity $63,186 $ 53,095 ** These investments are operating assets as they relate to associated companies. (a) Compute Intel's net operating assets (NOA) for year-end 2010. 2010 NOA = $ 31,170 x (b) Compute net operating profit after tax (NOPAT) for 2010, assuming a federal and state statutory tax rate of 37%. HINT: Gains/losses on equity method investments are considered operating income. Round your answer to the nearest whole number. 2010 NOPAT = $ 10,198 x (c) Use the parsimonious forecast method, as shown in Analysis Insight box on page 13-4, to forecast Cisco's sales, NOPAT, and NOA for 2011 through 2014 and the terminal period using the following assumptions. Sales growth 10% Net operating profit margin (NOPM) 26% Net operating asset turnover (NOAT) at fiscal year-end 1.50 Forecast the terminal period value using the assumptions above and assuming a terminal period growth of: 1% INTC Forecast Horizon Terminal Reported 2010 (5 millions) 2011 Est. 2013 Est 2014 Est. Period 2012 Est ONS Ox 0x1 ON Sales (rounded two decimal places) Sales (rounded nearest whole number) NOPAT (rounded nearest whole number) NOA (rounded nearest whole number) Ox ON 0x OM OXI ON OK ON tale 0x5 ON OX ON OXI ON 0x ON 0000 **** ON
Step by Step Solution
There are 3 Steps involved in it

Get step-by-step solutions from verified subject matter experts