

Question: The table below contains selected financial information from recent financial statements of KBI Toys and Little Tikes Adventure Toys, Inc., two toy manufacturing companies (5

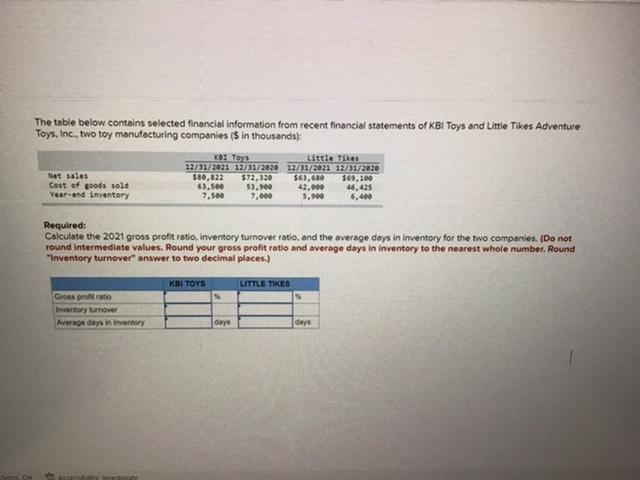
The table below contains selected financial information from recent financial statements of KBI Toys and Little Tikes Adventure Toys, Inc., two toy manufacturing companies (5 in thousands); Net sales Cost of goods sold Year and inventory KOT Toys Little Tikes 12/31/202112/31/2020 1273172021 12/31/2020 $80,822 572,320 $63,680 569,100 63,500 53,100 42,000 46,425 7.500 7,600 3.900 6,400 Required: Calculate the 2021 gross profit ratio, inventory turnover ratio, and the average days in inventory for the two companies. (Do not round Intermediate values. Round your gross profit ratio and average days in inventory to the nearest whole number. Round "Inventory turnover" answer to two decimal places.) KBL TOYS LITTLE TIKES Gross proto Inventory turnover Average days in mentory dayo days Mira
Step by Step Solution
There are 3 Steps involved in it

Get step-by-step solutions from verified subject matter experts