

Question: Selected data from the comparative statements of financial position of Vermillion Ltd. are shown below: 2024 2023 2022 Cash $150,000 $176,000 $73,000 Accounts receivable
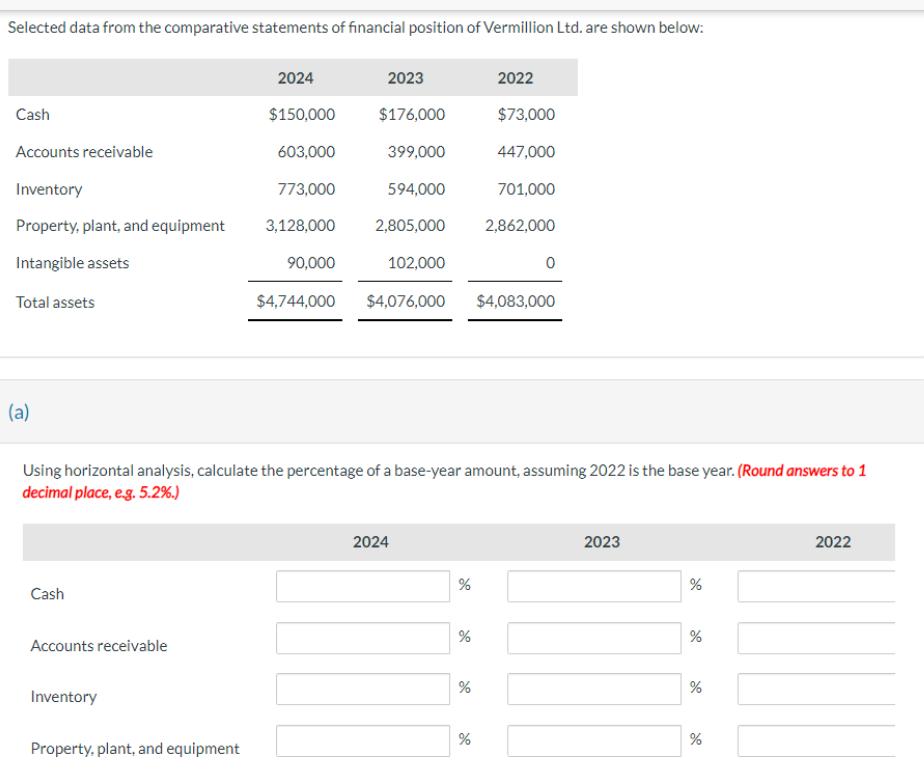
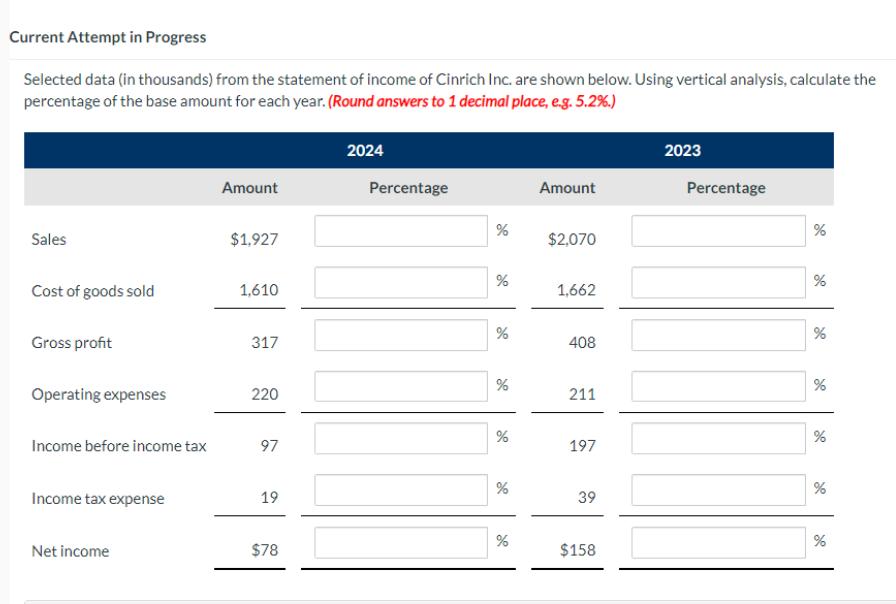
Selected data from the comparative statements of financial position of Vermillion Ltd. are shown below: 2024 2023 2022 Cash $150,000 $176,000 $73,000 Accounts receivable 603,000 399,000 447,000 Inventory 773,000 594,000 701,000 Property, plant, and equipment 3,128,000 2,805,000 2,862,000 Intangible assets 90,000 102,000 0 Total assets $4,744,000 $4,076,000 $4,083,000 (a) Using horizontal analysis, calculate the percentage of a base-year amount, assuming 2022 is the base year. (Round answers to 1 decimal place, e.g. 5.2%.) Cash Accounts receivable Inventory Property, plant, and equipment 2024 2023 % % % % de % do % % % 2022 Current Attempt in Progress Selected data (in thousands) from the statement of income of Cinrich Inc. are shown below. Using vertical analysis, calculate the percentage of the base amount for each year. (Round answers to 1 decimal place, e.g. 5.2%.) 2024 2023 Amount Percentage Amount Percentage % % $1,927 $2,070 % % 1,662 % % 317 408 % % 220 211 Sales Cost of goods sold 1,610 Gross profit Operating expenses % % Income before income tax 97 197 % % Income tax expense 19 39 % % Net income $78 $158
Step by Step Solution
There are 3 Steps involved in it

Get step-by-step solutions from verified subject matter experts