

Question: Transition Probability matrix What is the difference between univariate data and bivariate data? Choose the correct answer below. 0 A. In univariate data, a single
Transition Probability matrix
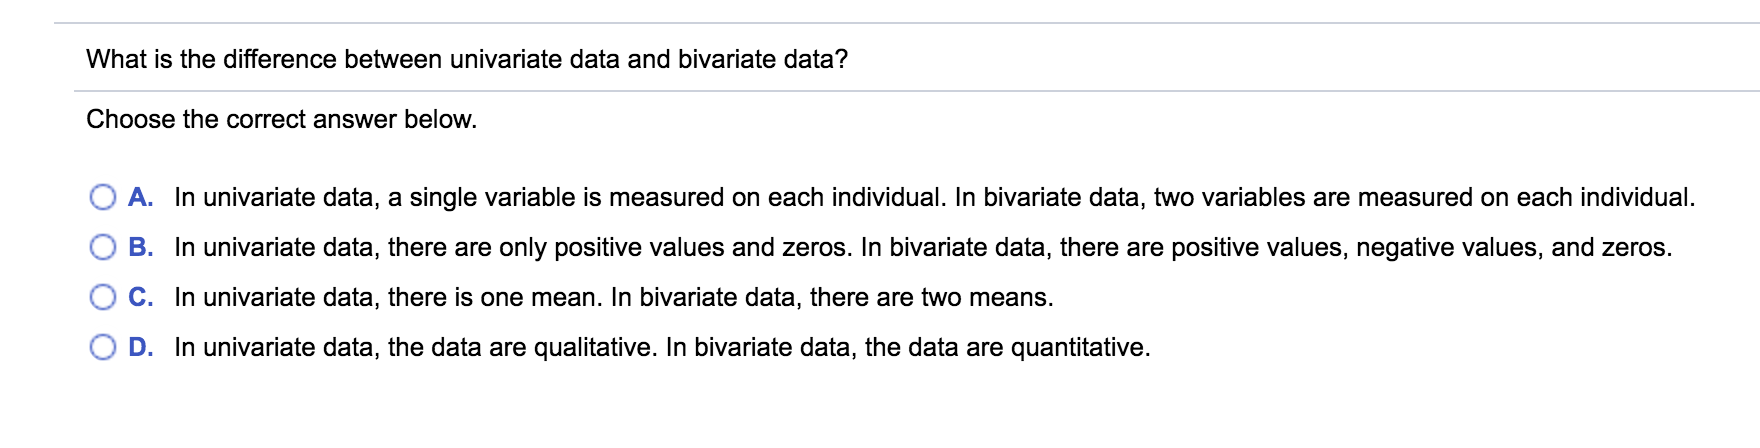
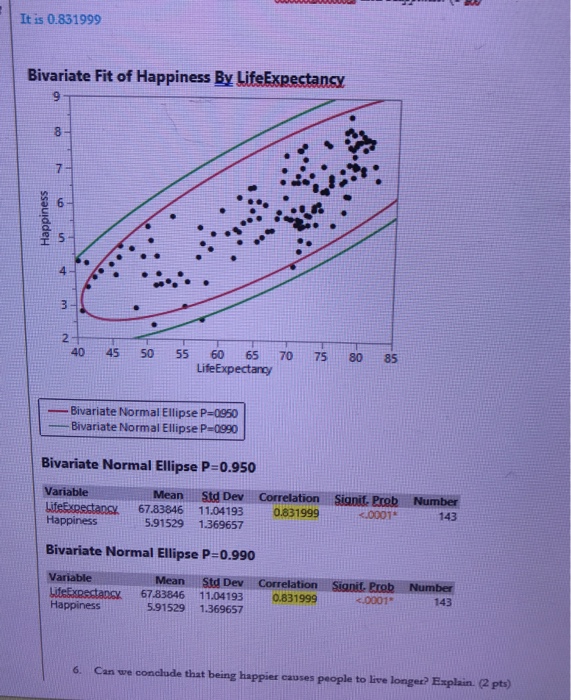
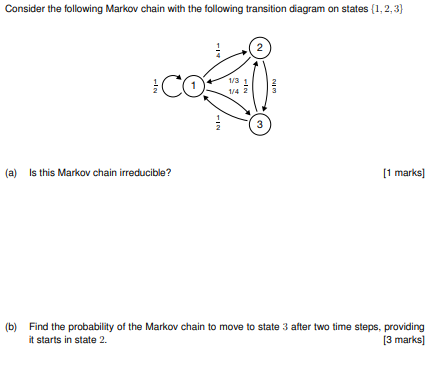
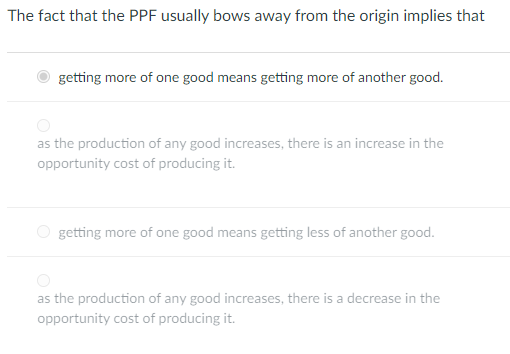
What is the difference between univariate data and bivariate data? Choose the correct answer below. 0 A. In univariate data, a single variable is measured on each individual. In bivariate data, two variables are measured on each individual. 0 B. In univariate data, there are only positive values and zeros. In bivariate data, there are positive values, negative values, and zeros. O C. In univariate data, there is one mean. In bivariate data, there are two means. 0 D. In univariate data, the data are qualitative. In bivariate data, the data are quantitative. It is 0.831999 Bivariate Fit of Happiness By LifeExpectancy Happiness un 40 45 50 55 60 65 70 80 85 LifeExpectancy Bivariate Normal Ellipse P=0950 Bivariate Normal Ellipse P=0990 Bivariate Normal Ellipse P=0.950 Variable Mean Std Dev Correlation Signit. Prob Number LifeExpectancy 67.83646 11.04193 0.631999 <.0001 happiness bivariate normal ellipse p="0.990" variable mean std dev correlation signit. prob number lifeexpectancy can we conclude that being happier causes people to live longer explain. pts the following markov chain with transition diagram on states al- co is this irreducible marks find probability of move state after two time steps providing it starts in fact f usually bows away from origin implies ii getting more one good means another good. as production any increases. there an increase opportunity cost producing it. less good- a decrease>
Step by Step Solution
There are 3 Steps involved in it

Get step-by-step solutions from verified subject matter experts