

Question: Transportation / Distribution Problem Assignment A distribution system has 3 DCs and 5 stores. Table 1 provides the transportation / distribution costs per route for
TransportationDistribution Problem Assignment
A distribution system has DCs and stores. Table provides the transportationdistribution costs per route for a family of high end computers. The available number of units as well as the requirements and penalties at each store are in Tables and respectively.
A Setup in ExcelSolver
B Perform a sensitivity analysis and consider the following scenarios.
Supply scenarios
Supply case Current situation.
Supply case Eliminating inveOry availability in DC units while DC will have and DC will have units available respectively. This would represent a cost reduction of $ in overhead.
Supply case Eliminating inventory availability in DC units while DC will have and DC will have units available respectively. This would represent a cost reduction of $ in overhead.
Demand scenarios
Demand case Current situation.
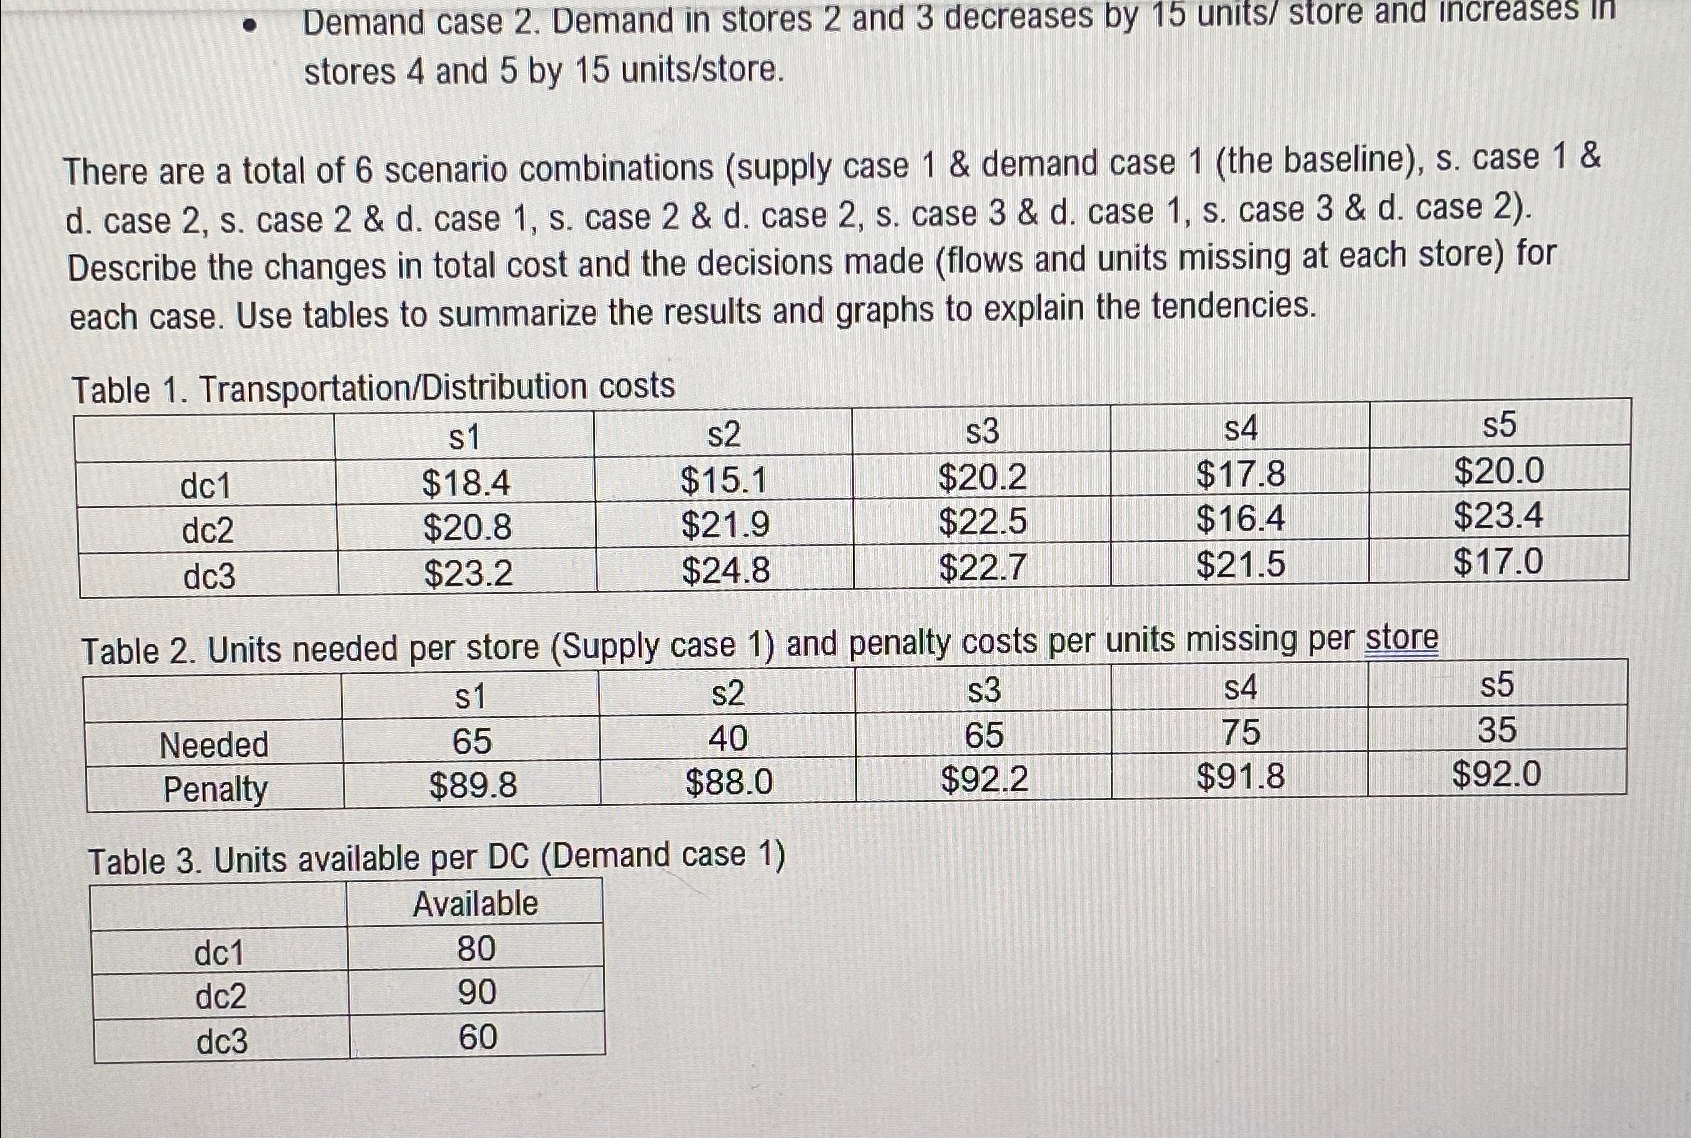
Demand case Demand in stores and decreases by units store and increases in stores and by unitsstore
There are a total of scenario combinations supply case & demand case the baseline s case & d case s case & d case s case & d case s case & d case s case & d case
Demand case Demand in stores and decreases by units store and increases in stores and by unitsstore
There are a total of scenario combinations supply case & demand case the baseline s case & d case s case & d case s case & d case s case & d case s case & d case Describe the changes in total cost and the decisions made flows and units missing at each store for each case. Use tables to summarize the results and graphs to explain the tendencies.
Table TransportationDistribution costs
tablesssssdc$$$$$
Step by Step Solution
There are 3 Steps involved in it
1 Expert Approved Answer
Step: 1 Unlock

Question Has Been Solved by an Expert!
Get step-by-step solutions from verified subject matter experts
Step: 2 Unlock
Step: 3 Unlock