

Question: Travel Demand Model Homework # 2 Due by 1 1 t h Feb 1 1 : 5 9 PM The population of Town A is
Travel Demand Model
Homework #
Due by Feb : PM
The population of Town A is Residents in Town A are desirous of participating in a number of daily activities. They have two choices
of where to access these activities:
locally, in their own town Town A or
in a neighboring, more cosmopolitan town Town B
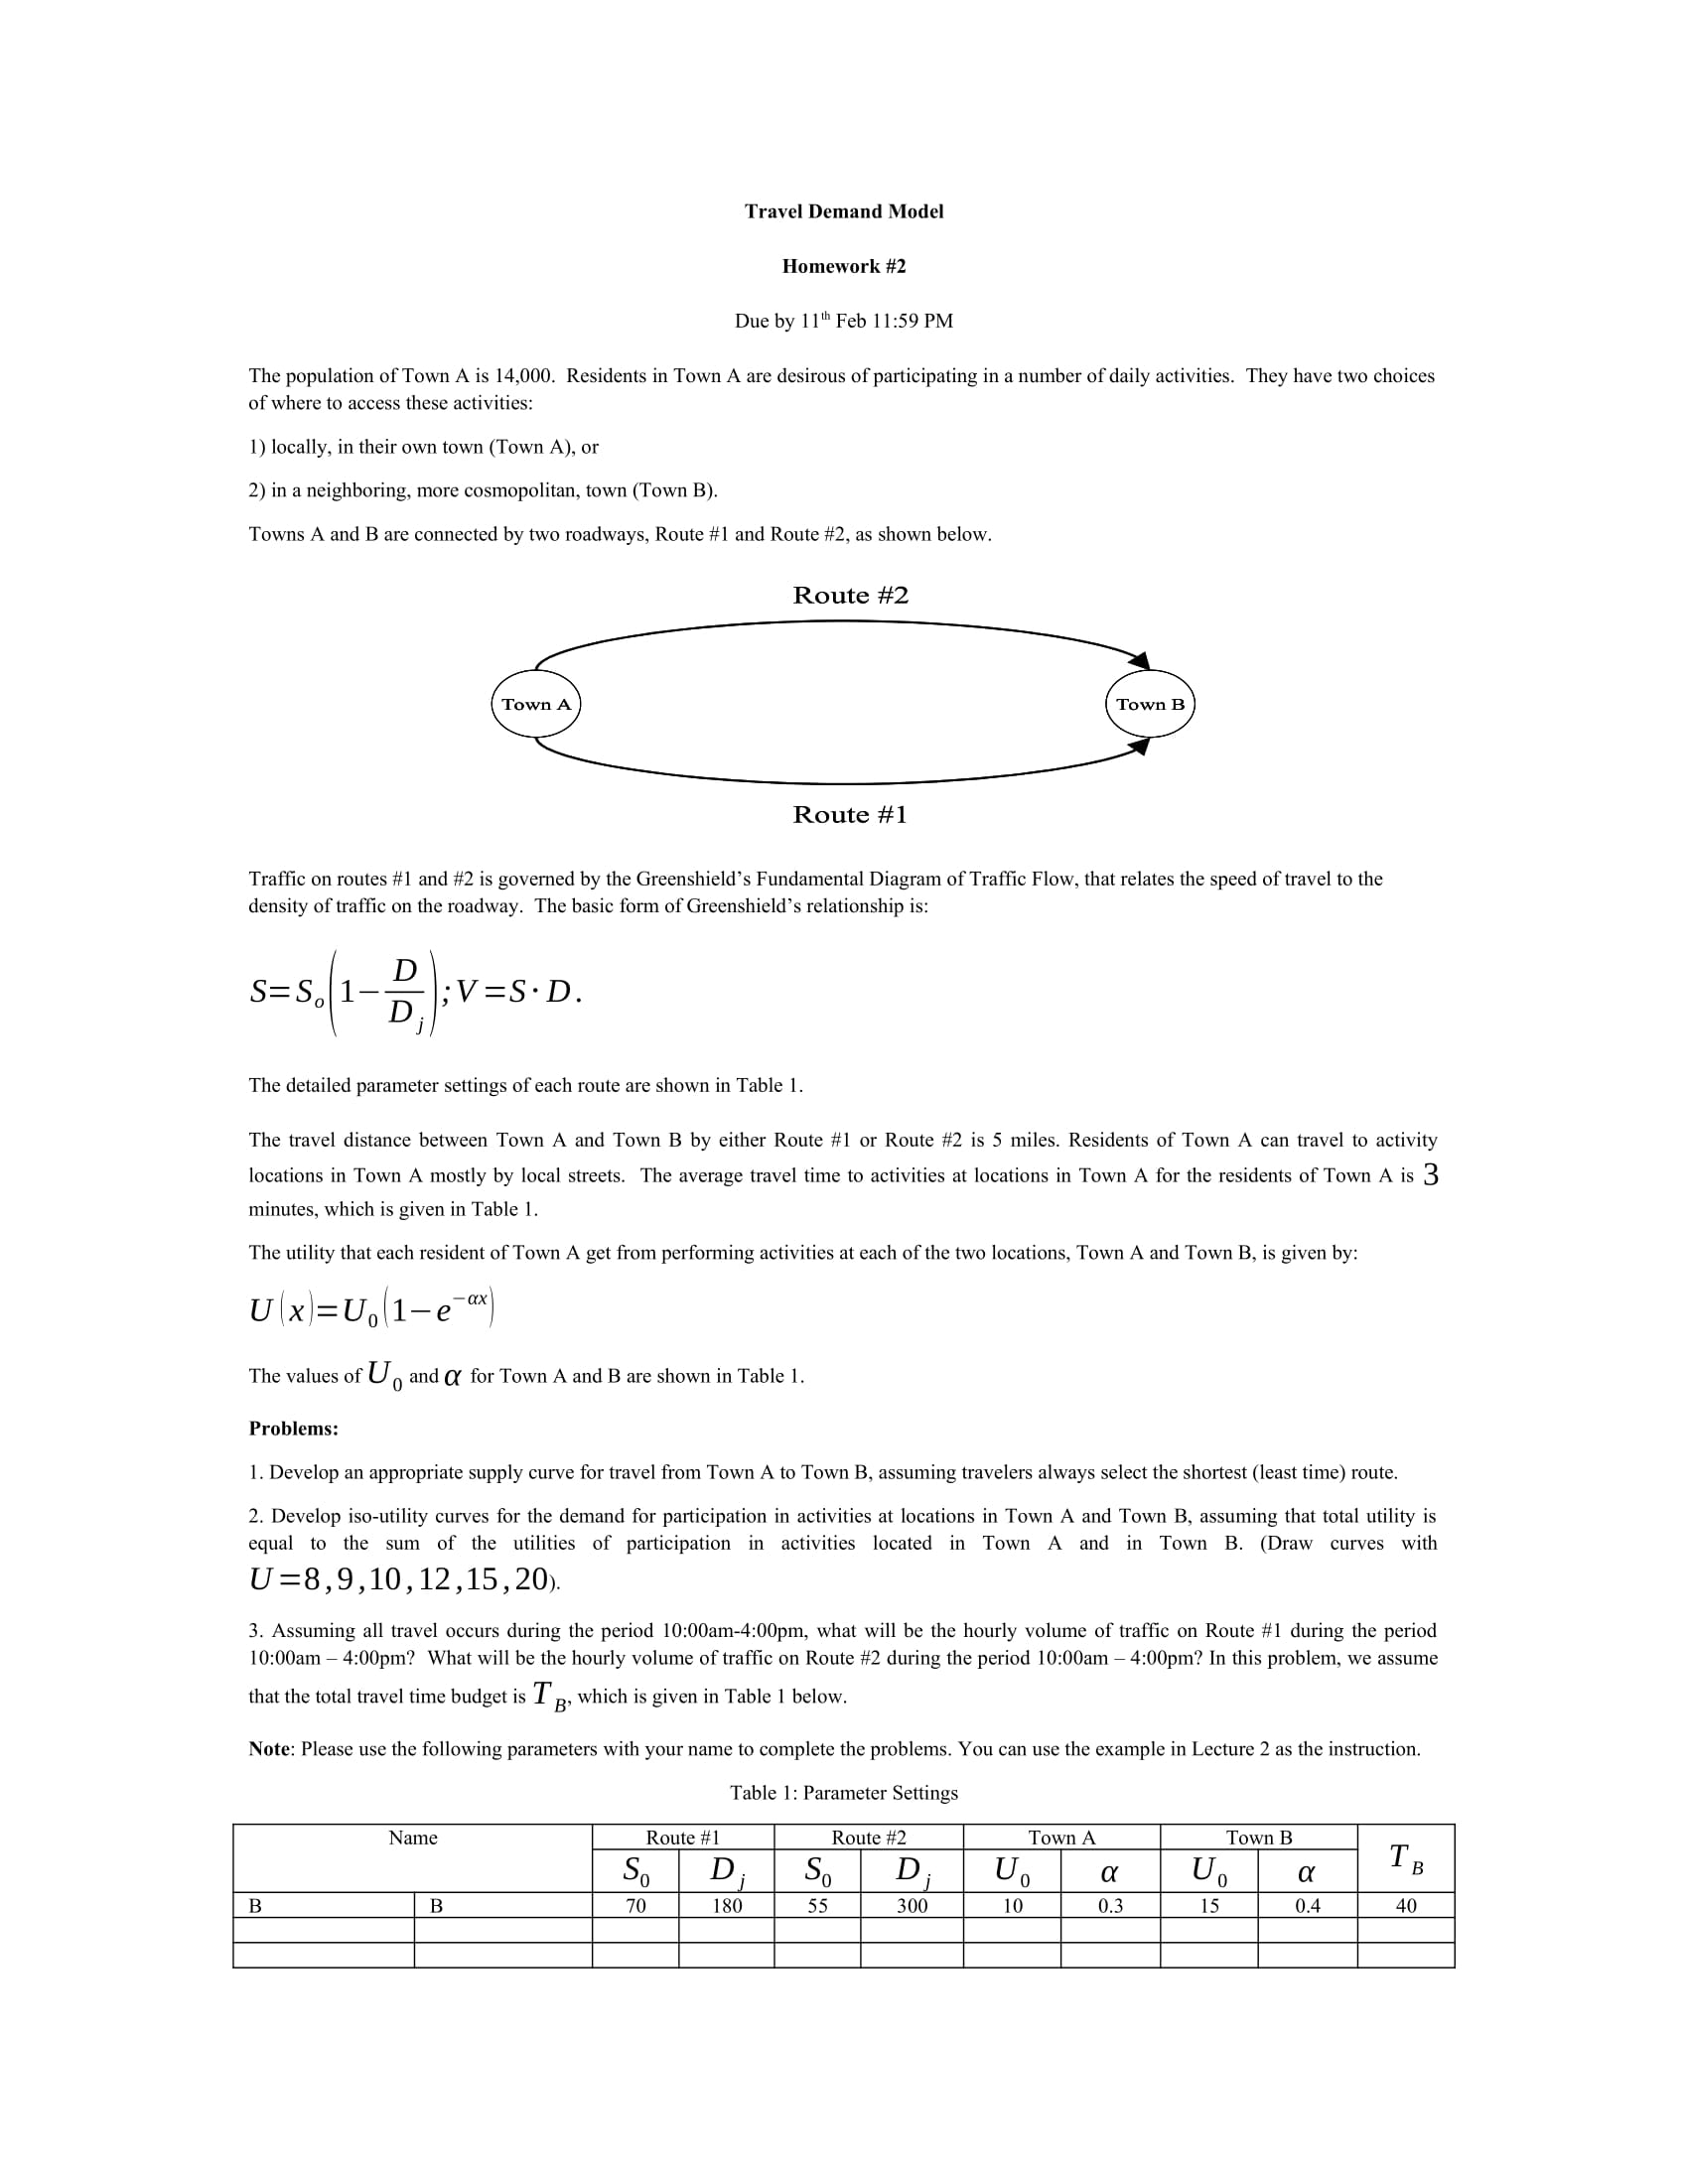
Towns A and B are connected by two roadways, Route # and Route # as shown below.
Traffic on routes # and # is governed by the Greenshield's Fundamental Diagram of Traffic Flow, that relates the speed of travel to the
density of traffic on the roadway. The basic form of Greenshield's relationship is:
;
The detailed parameter settings of each route are shown in Table
The travel distance between Town A and Town B by either Route # or Route # is miles. Residents of Town A can travel to activity
locations in Town A mostly by local streets. The average travel time to activities at locations in Town A for the residents of Town A is
minutes, which is given in Table
The utility that each resident of Town A get from performing activities at each of the two locations, Town A and Town B is given by:
The values of and for Town A and B are shown in Table
Problems:
Develop an appropriate supply curve for travel from Town A to Town B assuming travelers always select the shortest least time route.
Develop isoutility curves for the demand for participation in activities at locations in Town A and Town B assuming that total utility is
equal to the sum of the utilities of participation in activities located in Town A and in Town BDraw curves with
Assuming all travel occurs during the period :am:pm what will be the hourly volume of traffic on Route # during the period
: am :pm What will be the hourly volume of traffic on Route # during the period : am :pm In this problem, we assume
that the total travel time budget is which is given in Table below.
Note: Please use the following parameters with your name to complete the problems. You can use the example in Lecture as the instruction.
Table : Parameter Settings
Step by Step Solution
There are 3 Steps involved in it
1 Expert Approved Answer
Step: 1 Unlock

Question Has Been Solved by an Expert!
Get step-by-step solutions from verified subject matter experts
Step: 2 Unlock
Step: 3 Unlock