

Question: Trend analysis Plz help PROBLEM 6.3B Trend Analysis LO6-8@ Shown as follows is information from the financial reports of Pete's Auto Parts for the past
 Trend analysis
 Plz help
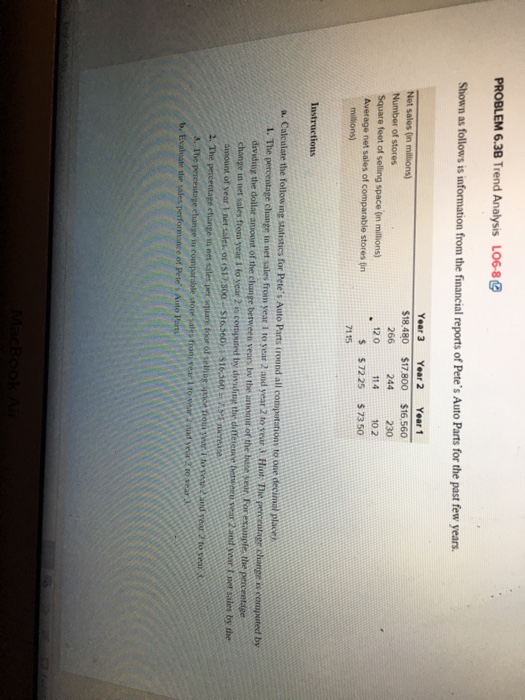
PROBLEM 6.3B Trend Analysis LO6-8@ Shown as follows is information from the financial reports of Pete's Auto Parts for the past few years. Year 3 Year2 Year 1 18.480 $17,800 $16,560 266 244 230 120 114 102 S $7225 $ 7350 Number of stores Square feet of selling space (in millions) Average net sales of comparable stores in miltions) 7115 s to one decimel place 1. The year 2 to yearHiot he percentagr change is computed by l fo vear 2 dattererce be er2aot year t pet sulee by the the
Step by Step Solution
There are 3 Steps involved in it
1 Expert Approved Answer
Step: 1 Unlock

Question Has Been Solved by an Expert!
Get step-by-step solutions from verified subject matter experts
Step: 2 Unlock
Step: 3 Unlock