

Question: Trip Generation The following table shows the data collected from a household survey for 3 zones A , B , and C : table
Trip Generation
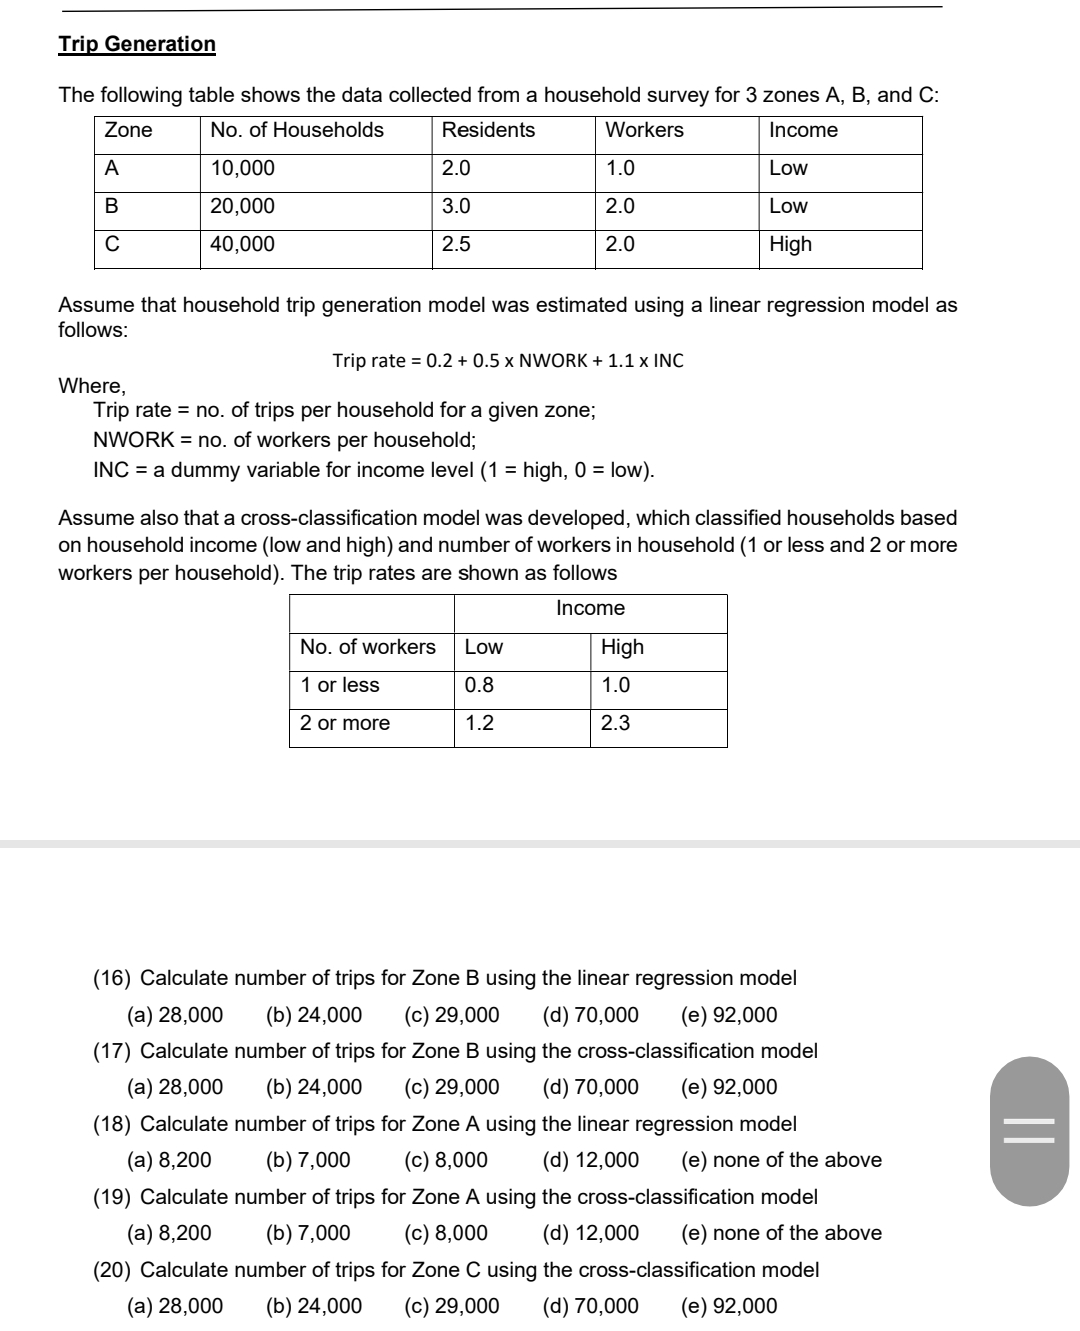
The following table shows the data collected from a household survey for zones and :
tableZoneNo of Households,Residents,Workers,IncomeALowBLowCHigh
Assume that household trip generation model was estimated using a linear regression model as follows:
Trip rate NWORK INC
Where,
Trip rate no of trips per household for a given zone;
NWORK no of workers per household;
INC a dummy variable for income level high, low
Step by Step Solution
There are 3 Steps involved in it
1 Expert Approved Answer
Step: 1 Unlock

Question Has Been Solved by an Expert!
Get step-by-step solutions from verified subject matter experts
Step: 2 Unlock
Step: 3 Unlock