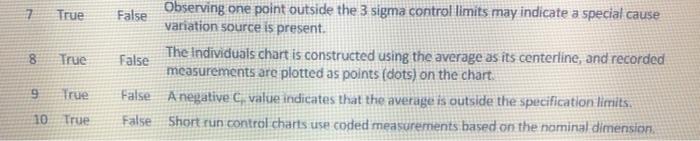
Question: True 8 True False Observing one point outside the 3 sigma control limits may indicate a special cause variation source is present. The Individuals chart

True 8 True False Observing one point outside the
True 8 True False Observing one point outside the 3 sigma control limits may indicate a special cause variation source is present. The Individuals chart is constructed using the average as its centerline, and recorded False measurements are plotted as points (dots) on the chart False A negative e value indicates that the average is outside the specification limits. False Short run control charts use coded measurements based on the nominal dimension 9 True 10 True

Step by Step Solution

There are 3 Steps involved in it

1 Expert Approved Answer
Step: 1 Unlock blur-text-image
Question Has Been Solved by an Expert!

Get step-by-step solutions from verified subject matter experts

Step: 2 Unlock
Step: 3 Unlock

Students Have Also Explored These Related General Management Questions!