

Question: True or false and please explain why Question 4: The figure below shows the risk and expected return of 4 given assets. B 25 expected
True or false and please explain why
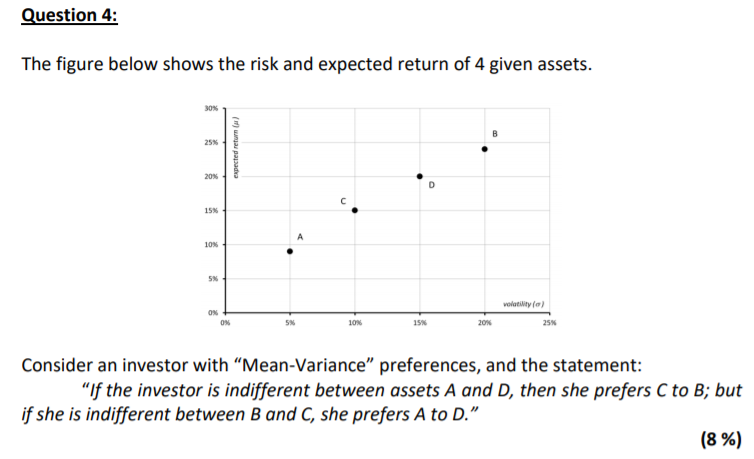
Question 4: The figure below shows the risk and expected return of 4 given assets. B 25 expected return 20% 15% 10% 5% volatility ( ) ON ON 5% 10% 15 20% 25 Consider an investor with Mean-Variance preferences, and the statement: "If the investor is indifferent between assets A and D, then she prefers C to B; but if she is indifferent between B and C, she prefers A to D." (8 %)
Step by Step Solution
There are 3 Steps involved in it
1 Expert Approved Answer
Step: 1 Unlock

Question Has Been Solved by an Expert!
Get step-by-step solutions from verified subject matter experts
Step: 2 Unlock
Step: 3 Unlock