

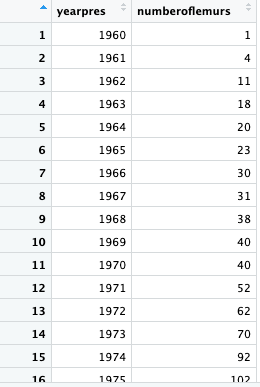
Question: trying to plot the # of lemurs ( right column ) by year ( left column ) . How do I do this? table
trying to plot the # of lemurs right column by year left column How do I do this?
tableyearpres,numberoflemurs
Step by Step Solution
There are 3 Steps involved in it
1 Expert Approved Answer
Step: 1 Unlock

Question Has Been Solved by an Expert!
Get step-by-step solutions from verified subject matter experts
Step: 2 Unlock
Step: 3 Unlock