

Question: Trying to solve this ASAP any help? This graph represents data collected on the difference between commute times in Austin and D.C.. Use this output
Trying to solve this ASAP any help?
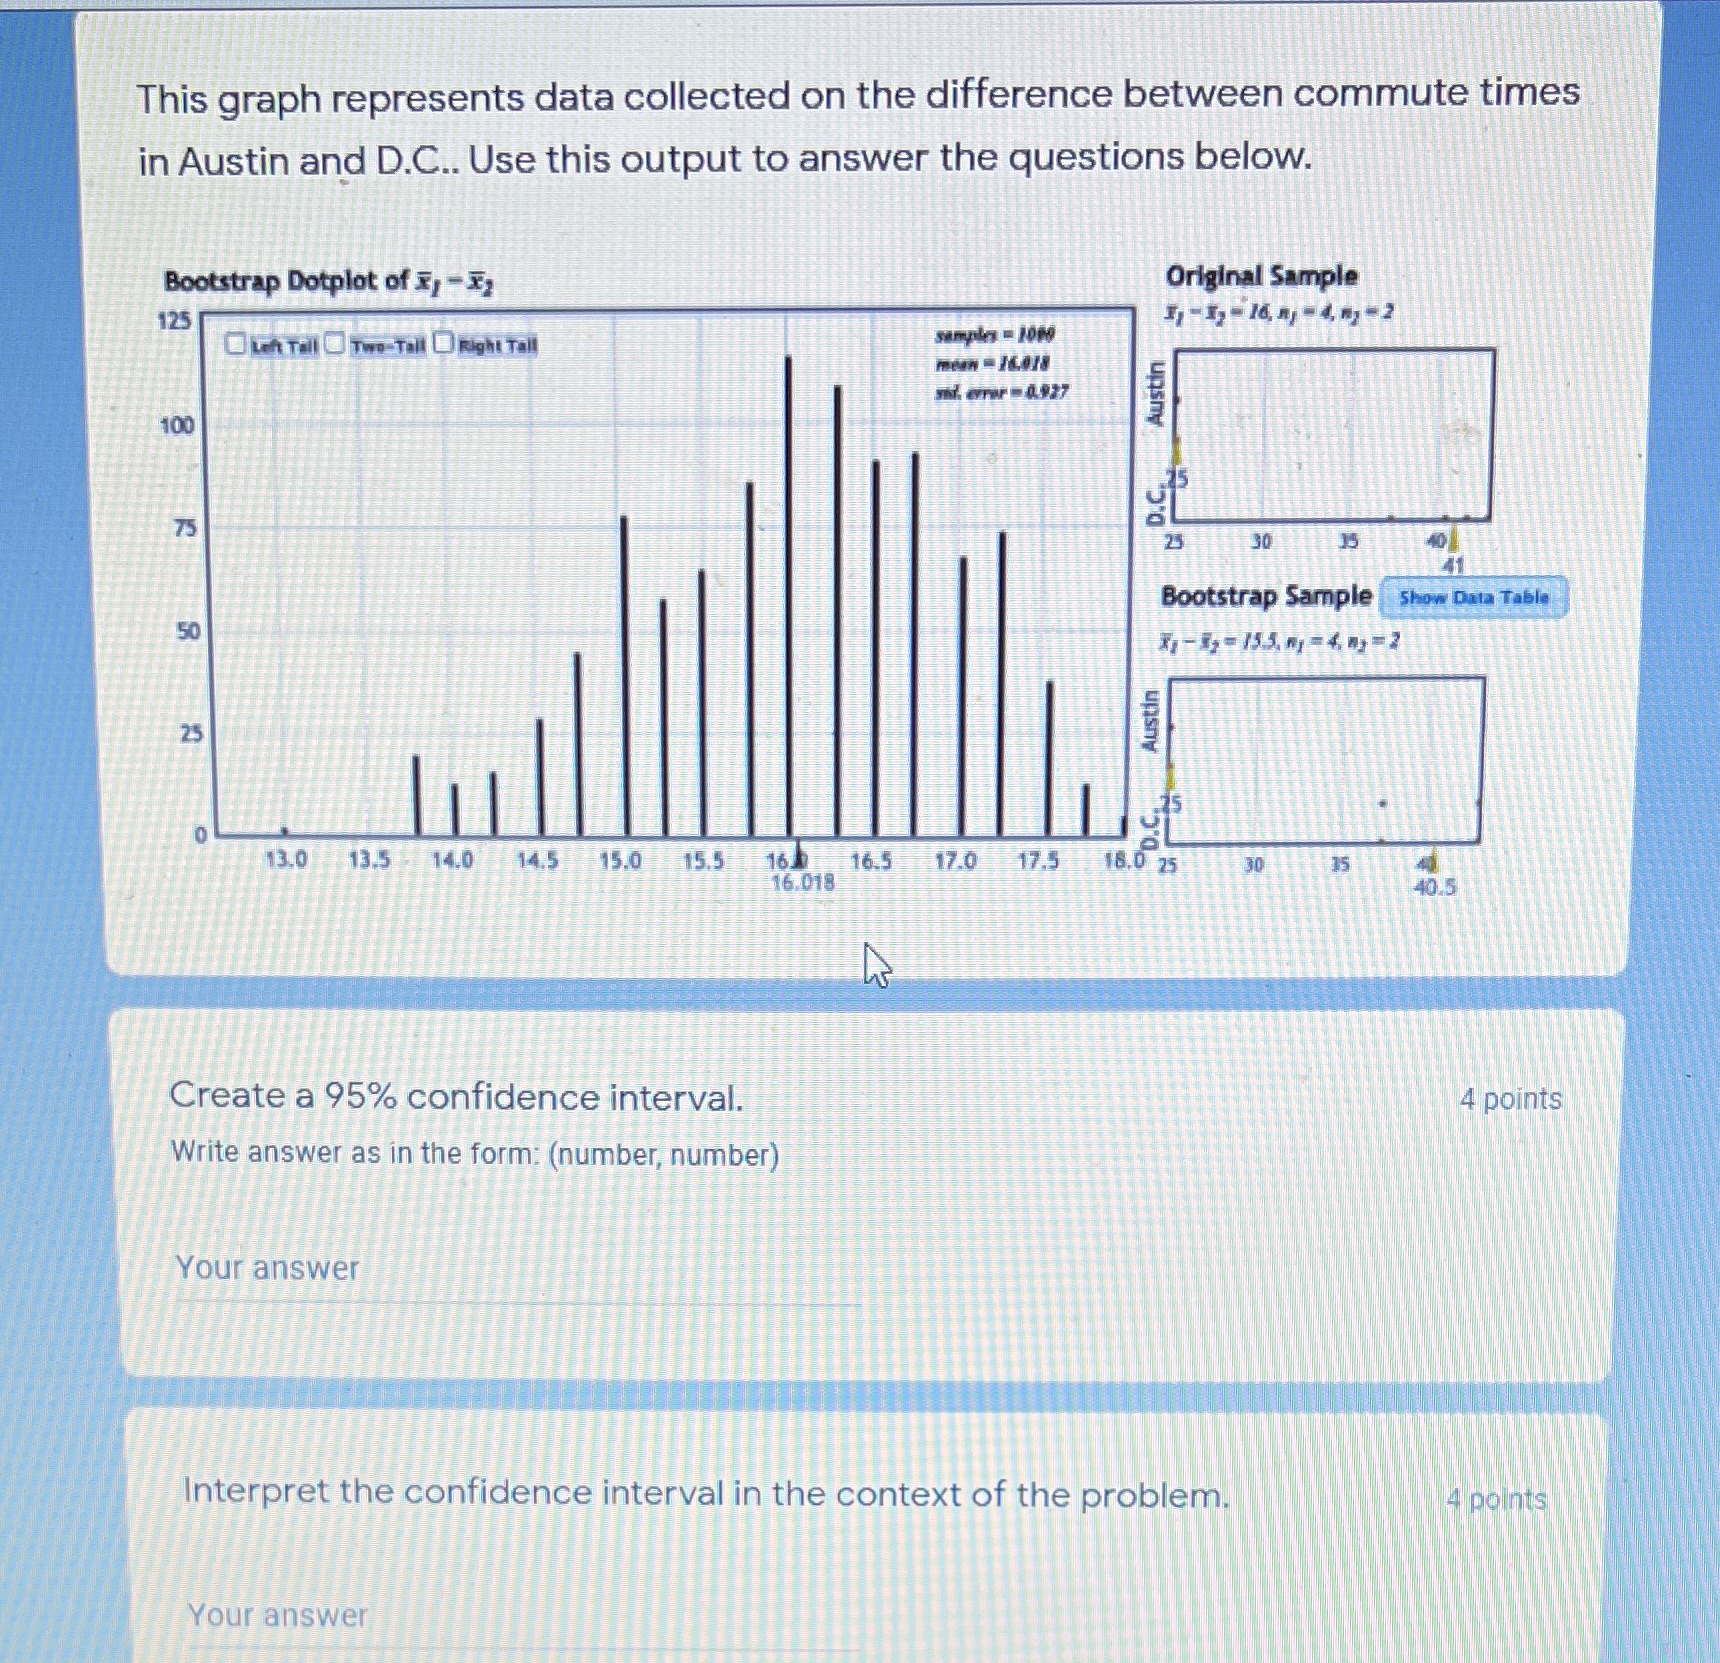
This graph represents data collected on the difference between commute times in Austin and D.C.. Use this output to answer the questions below. Bootstrap Dotplot of X, - X, Original Sample 125 - - 16 4 -4- -2 LA Tall Two-Tall Right Tall samples = 1080 Austin 100 -75 75 Bootstrap Sample Show Data Table 50 Austin 25 13.0 13.5 14.0 14.5 15.0 15.5 16.5 17.0 17.5 18.0 25 16.018 40.5 Create a 95% confidence interval. 4 points Write answer as in the form: (number, number) Your answer Interpret the confidence interval in the context of the problem. 4 points Your
Step by Step Solution
There are 3 Steps involved in it
1 Expert Approved Answer
Step: 1 Unlock

Question Has Been Solved by an Expert!
Get step-by-step solutions from verified subject matter experts
Step: 2 Unlock
Step: 3 Unlock