

Question: T-Test Group Statistics Std. Std. Error X3 - Firm Size N Mean Deviation Mean X6 - Product Quality Small (0 to 499) 49 7.953 1.4042

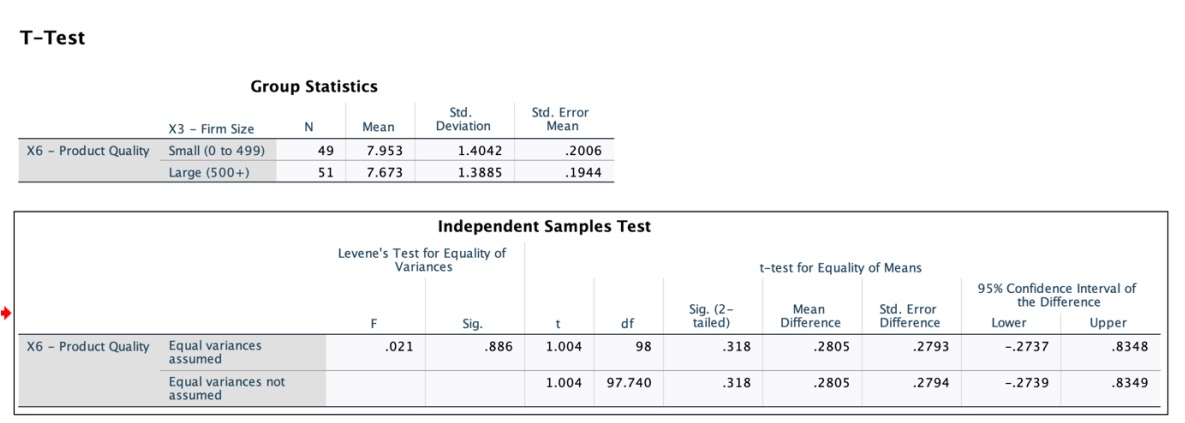
T-Test Group Statistics Std. Std. Error X3 - Firm Size N Mean Deviation Mean X6 - Product Quality Small (0 to 499) 49 7.953 1.4042 2006 Large (500+) 51 7.673 1.3885 .1944 Independent Samples Test Levene's Test for Equality of Variances t-test for Equality of Means 95% Confidence Interval of Sig. (2- Mean Std. Error the Difference F Sig. df tailed) Difference Difference Lower Upper X6 - Product Quality Equal variances .021 .886 1.004 98 .318 .2805 2793 -.2737 .8348 assumed Equal variances not 1.004 97.740 .318 .2805 2794 -.2739 .8349 assumed
Step by Step Solution
There are 3 Steps involved in it
1 Expert Approved Answer
Step: 1 Unlock

Question Has Been Solved by an Expert!
Get step-by-step solutions from verified subject matter experts
Step: 2 Unlock
Step: 3 Unlock