

Question: T-TestGroup Statistics Had hypertension N Mean Std. Deviation Std. Error MeanHad Stroke .00 125 .2640 .44257 .03958 1.00 55 .5818 .49781 .06712Independent Samples Test Levene's
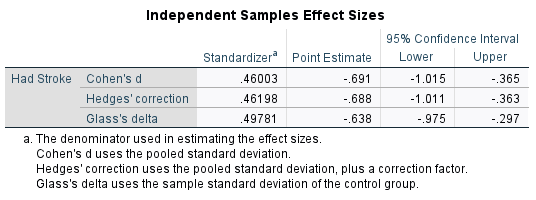
T-TestGroup Statistics Had hypertension N Mean Std. Deviation Std. Error MeanHad Stroke .00 125 .2640 .44257 .03958 1.00 55 .5818 .49781 .06712Independent Samples Test Levene's Test for Equality of Variances t-test for Equality of Means F Sig. t df Significance Mean Difference Std. Error Difference 95% Confidence Interval of the Difference One-Sided p Two-Sided p Lower UpperHad Stroke Equal variances assumed 11.318 <.001 .07444 equal variances not assumed .07793 samples effect sizes standardizera point estimate confidence interval lower upperhad stroke cohen d .46003 hedges correction .46198 glass delta .49781 the denominator used in estimating sizes. uses pooled standard deviation. ucreate lengthy paragrah for each question censoring variable given that you wish to evaluate eventstroke.2 identify time-to-event and produce a frequency table todetermine presence of ties.3 independent exposure status thefollowing research question: is there an association betweenhypertension time person was followed before experiencing astroke create with above variables their role this analysist-test>
Step by Step Solution
There are 3 Steps involved in it

Get step-by-step solutions from verified subject matter experts