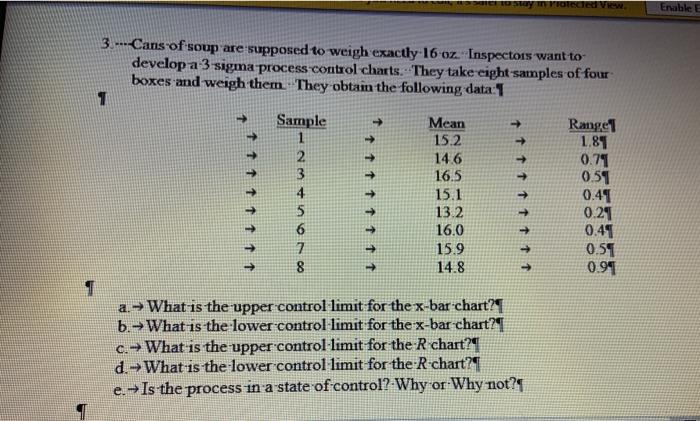
Question: - Tu | PHOI l V-. Enable E 3.-Cans of soup are supposed to weigh exactly 16 oz. Inspectors want to develop a

" " - Tu | PHOI l V-. Enable E 3.-Cans of soup
" " - Tu | PHOI l V-. Enable E 3.-Cans of soup are supposed to weigh exactly 16 oz. Inspectors want to develop a 3 sigma process control charts. They take eight samples of four boxes and weigh them. They obtain the following data: 1 Sample Mean Rangel 1 15.2 1.81 2 14.6 0.71 3 16.5 051 4 15.1 0.41 5 13.2 0.21 6 16.0 0.44 7 15.9 0.51 8 14.8 0.91 1 1 1 1 1 1 1 OWN 1 1 1 1 1 1 1 ttttttt a.- What is the upper control limit for the x-bar-chart? b. What is the lower control limit for the x-bar-chart? c. What is the upper-control-limit for the R chart?! d. What is the lower control limit for the R-chart? e. Is the process in a state of control? Why or Why not

Step by Step Solution

There are 3 Steps involved in it

1 Expert Approved Answer
Step: 1 Unlock blur-text-image
Question Has Been Solved by an Expert!

Get step-by-step solutions from verified subject matter experts

Step: 2 Unlock
Step: 3 Unlock

Students Have Also Explored These Related General Management Questions!