

Question: Tutor, please help me with detailed explanation. It should not be conducted by any software like excel. It requires by hand writing. Thanks. Health Promotion
Tutor, please help me with detailed explanation. It should not be conducted by any software like excel. It requires by hand writing. Thanks.
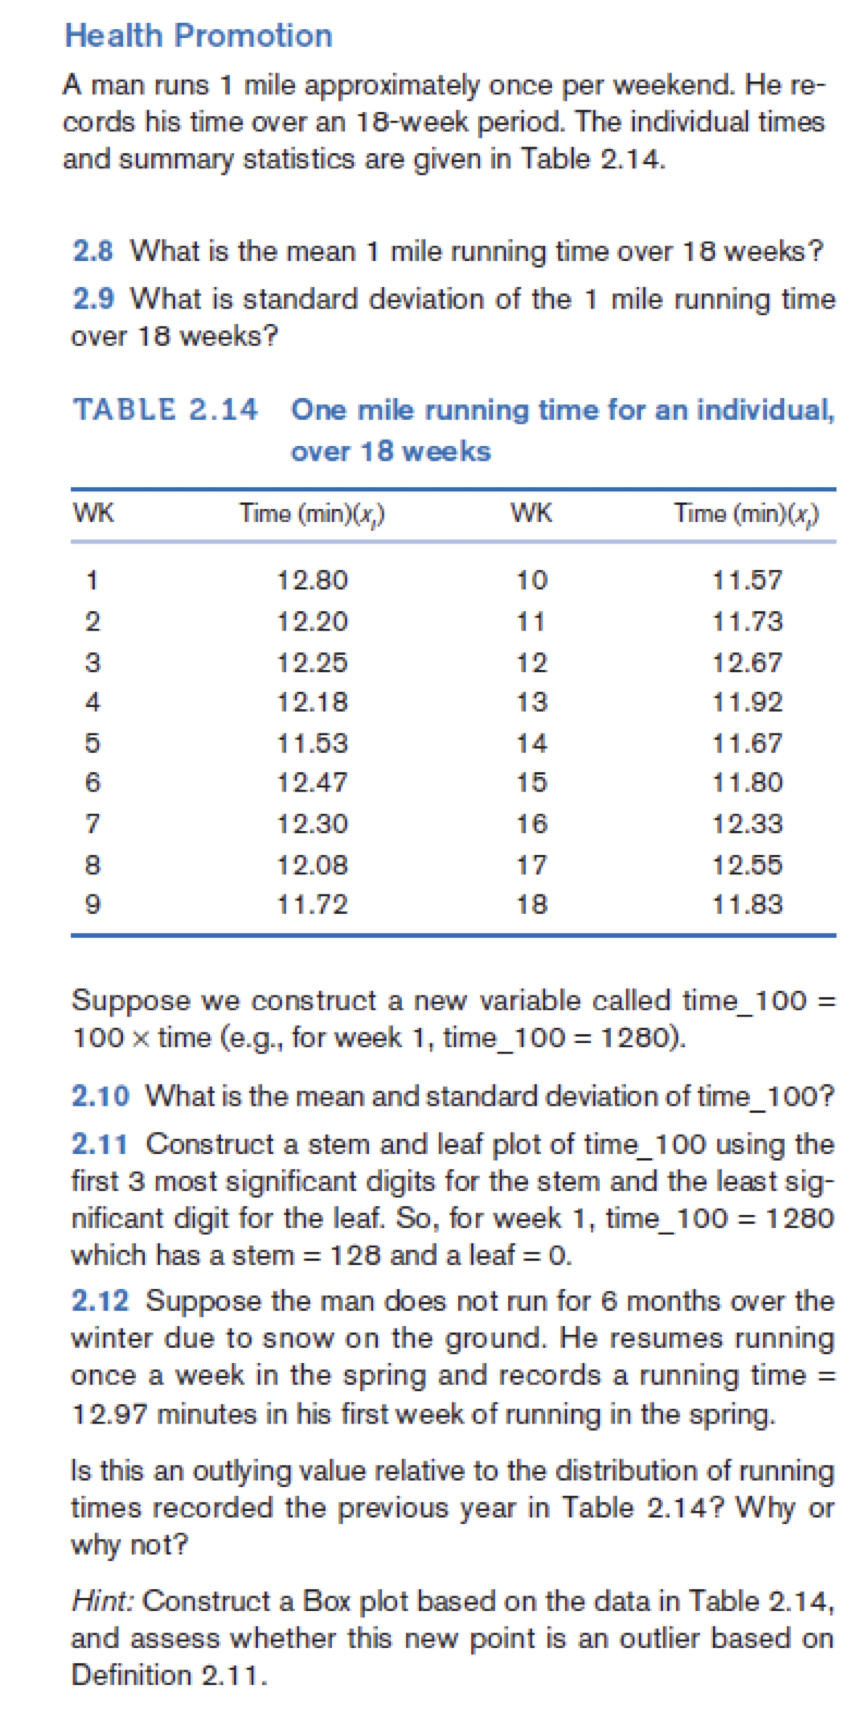
Health Promotion A man runs 1 mile approximately once per weekend. He re- cords his time over an 18-week period. The individual times and summary statistics are given in Table 2.14. 2.8 What is the mean 1 mile running time over 18 weeks? 2.9 What is standard deviation of the 1 mile running time over 18 weeks? TABLE 2.14 One mile running time for an individual, over 18 weeks WK Time (min)(x,) WK Time (min)(x) 12.80 10 11.57 12.20 11 11.73 12.25 12 12.67 12.18 13 11.92 11.53 14 11.67 12.47 15 11.80 12.30 16 12.33 12.08 17 12.55 11.72 18 11.83 Suppose we construct a new variable called time_100 = 100 x time (e.g., for week 1, time_100 = 1280). 2.10 What is the mean and standard deviation of time_100? 2.11 Construct a stem and leaf plot of time_100 using the first 3 most significant digits for the stem and the least sig- nificant digit for the leaf. So, for week 1, time_100 = 1280 which has a stem = 128 and a leaf = 0. 2.12 Suppose the man does not run for 6 months over the winter due to snow on the ground. He resumes running once a week in the spring and records a running time = 12.97 minutes in his first week of running in the spring. Is this an outlying value relative to the distribution of running times recorded the previous year in Table 2.14? Why or why not? Hint: Construct a Box plot based on the data in Table 2.14, and assess whether this new point is an outlier based on Definition 2.11
Step by Step Solution
There are 3 Steps involved in it

Get step-by-step solutions from verified subject matter experts