

Question: Two Data Sets of 34 integers each are summarized in the histograms as shown. For each of the histograms, the first interval represents the frequency
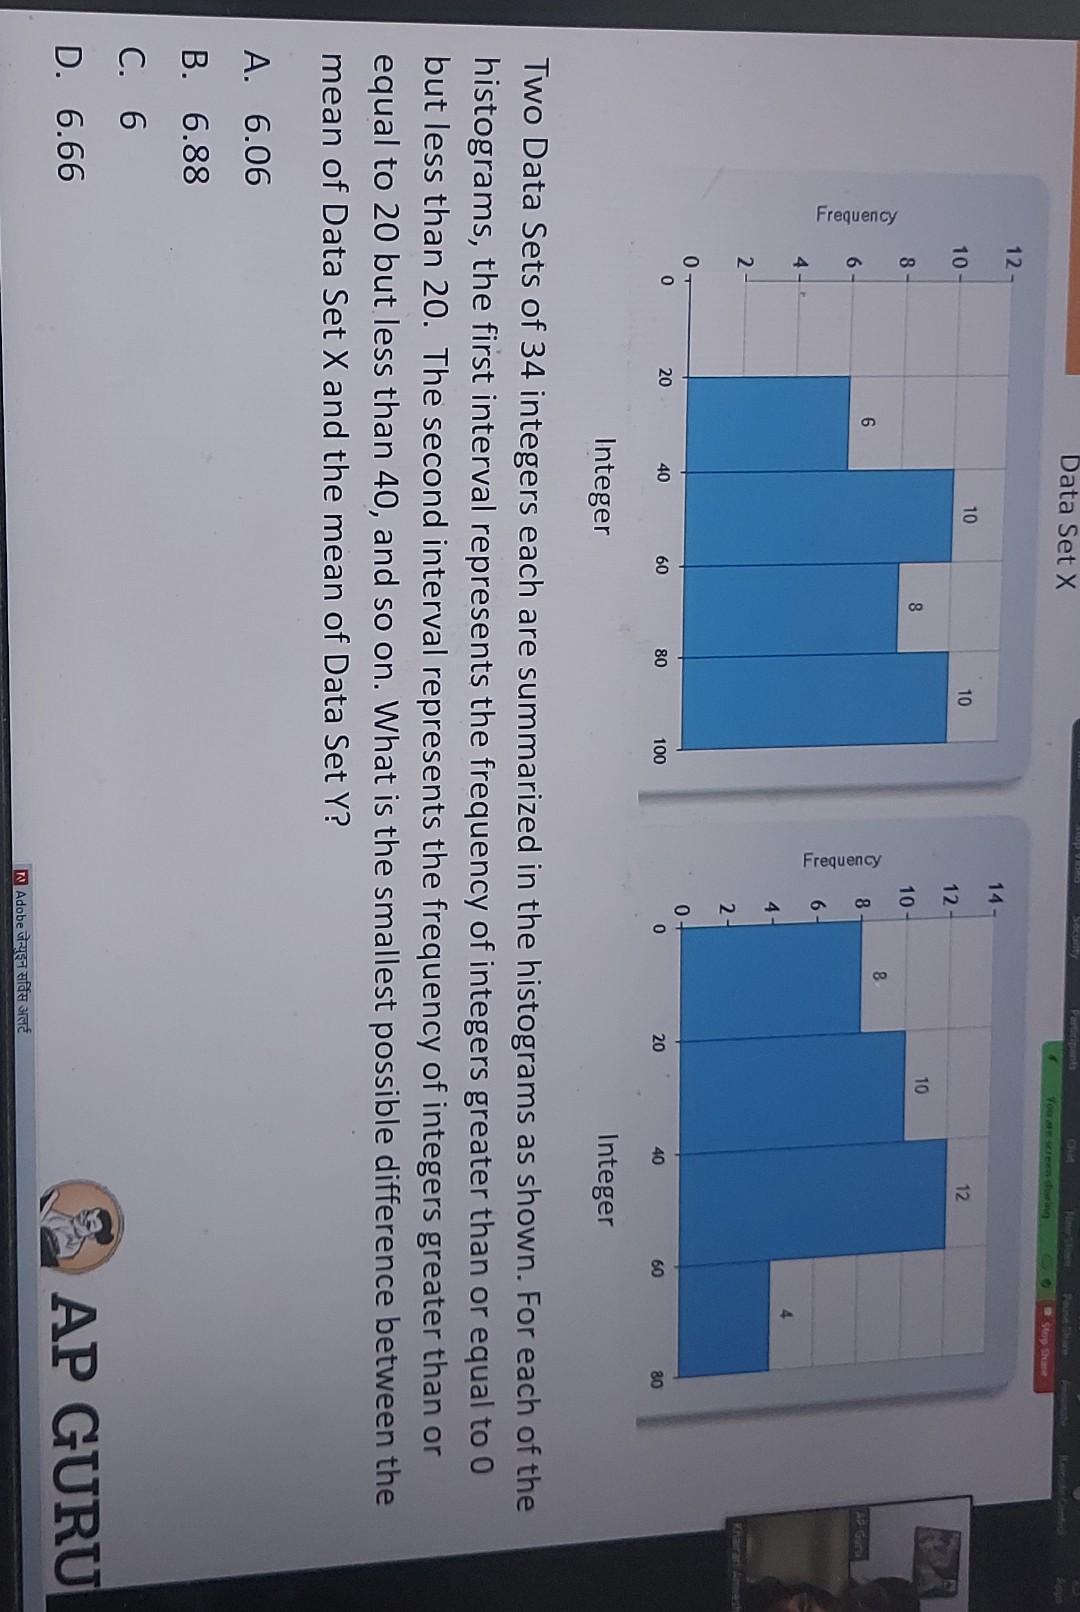
Two Data Sets of 34 integers each are summarized in the histograms as shown. For each of the histograms, the first interval represents the frequency of integers greater than or equal to 0 but less than 20. The second interval represents the frequency of integers greater than or equal to 20 but less than 40 , and so on. What is the smallest possible difference between the mean of Data Set X and the mean of Data Set Y ? A. 6.06 B. 6.88 C. 6 D. 6.66 AP GUR
Step by Step Solution
There are 3 Steps involved in it
1 Expert Approved Answer
Step: 1 Unlock

Question Has Been Solved by an Expert!
Get step-by-step solutions from verified subject matter experts
Step: 2 Unlock
Step: 3 Unlock