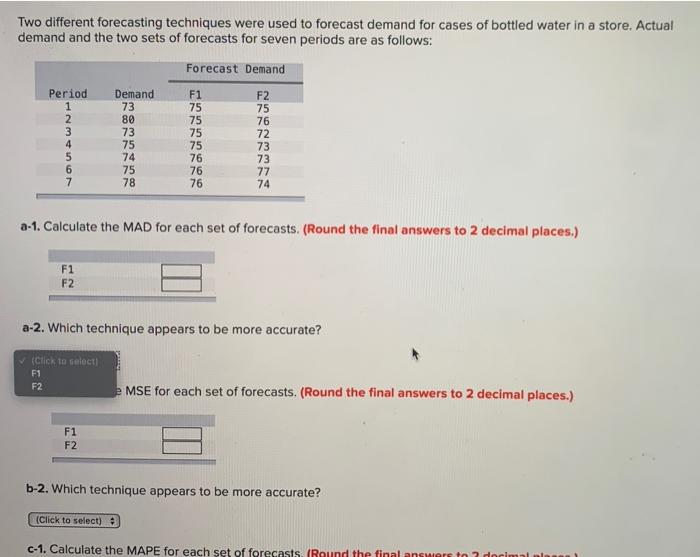
Question: Two different forecasting techniques were used to forecast demand for cases of bottled water in a store. Actual demand and the two sets of forecasts

Two different forecasting techniques were used to
Two different forecasting techniques were used to forecast demand for cases of bottled water in a store. Actual demand and the two sets of forecasts for seven periods are as follows: Forecast Demand 7 Period 1 2 3 Demand 73 80 73 75 74 75 78 F1 75 75 75 75 76 76 76 F2 75 76 72 73 73 77 74 5 6 7 a-1. Calculate the MAD for each set of forecasts. (Round the final answers to 2 decimal places.) F1 F2 a-2. Which technique appears to be more accurate? Click to select F1 F2 MSE for each set of forecasts. (Round the final answers to 2 decimal places.) F1 F2 b-2. Which technique appears to be more accurate? (Click to select) C-1. Calculate the MAPE for each set of forecasts (Round the final answers to 7 decimal noun (Click to select) b-1. Calculate the MSE for each set of forecasts. (Round the final answers to 2 decimal places.) F1 F2 b-2. Which technique appears to be more accurate? (Click to select) c-1. Calculate the MAPE for each set of forecasts. (Round the final answers to 2 decimal places.) F1 F2 c-2. Which technique appears to be more accurate? (Click to select) d-1. Do all three of forecast errors provide the same conclusion (i.e., are they consistent) in this case? (Click to select) 9 d-2. Do you expect consistent results in every case? (Click to select) (Click to select) will have lower MSE than (Click to select) if obs 7 for Ft was 81. e. In practice, either MAD, MSE, or MAPE would be employed to compute a measure of forecast errors. What factors might lead a manager to favour one? MAD MSE (Click to select) (Click to select) (Click to select) MAPE F1 F2 b-2. Which technique appears to be more accurate? (Click to select) c-1. Calculate the MAPE for each set of forecasts. (Round the final answers to 2 decimal places.) F1 F2 c-2. Which technique appears to be more accurate? (Click to select) d-1. Do all three of forecast errors provide the same conclusion (.e. are they consistent) in this case? (Click to select) d-2. Do you expect consistent results in every case? (Click to select) : (Click to select) will have lower MSE than (Click to select) If obs 7 for F1 was 81. e. In practice, either MAD, MSE, or MAPE would be employed to compute a measure of forecast errors. What factors might lead a manager to favour one? MAD MSE MAPE (Click to select) is more sensitive to large forecast errors. is easy to calculate is easy to understand

Step by Step Solution

There are 3 Steps involved in it

1 Expert Approved Answer
Step: 1 Unlock blur-text-image
Question Has Been Solved by an Expert!

Get step-by-step solutions from verified subject matter experts

Step: 2 Unlock
Step: 3 Unlock

Students Have Also Explored These Related General Management Questions!