

Question: Two different forecasting techniques were used to forecast demand for cases of bottled water in a store. Actual demand and the two sets of forecasts
| Forecast Demand | |||
| Period | Demand | F1 | F2 |
| 1 | 67 | 70 | 70 |
| 2 | 75 | 70 | 71 |
| 3 | 69 | 70 | 72 |
| 4 | 71 | 71 | 73 |
| 5 | 68 | 71 | 70 |
| 6 | 70 | 71 | 73 |
| 7 | 74 | 72 | 73 |
a-1. Calculate the MAD for each set of forecasts. (Round the final answers to 2 decimal places.)
| F1 | ||
| F2 | ||
a-2. Which technique appears to be more accurate? (Click to select) F2 F1
b-1. Calculate the MSE for each set of forecasts. (Round the final answers to 2 decimal places.)
| F1 | ||
| F2 | ||
b-2. Which technique appears to be more accurate? (Click to select) F2 F1
c-1. Calculate the MAPE for each set of forecasts. (Round the final answers to 2 decimal places.)
| F1 | % | |
| F2 | % | |
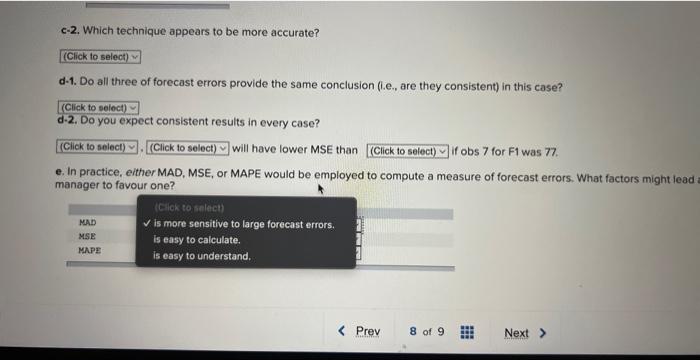
c-2. Which technique appears to be more accurate? (Click to select) F1 F2
d-1. Do all three of forecast errors provide the same conclusion (i.e., are they consistent) in this case? (Click to select) No Yes
d-2. Do you expect consistent results in every case? (Click to select) Yes No , (Click to select) F1 F2 will have lower MSE than (Click to select) F1 F2 if obs 7 for F1 was 77.
e. In practice, either MAD, MSE, or MAPE would be employed to compute a measure of forecast errors. What factors might lead a manager to favour one?
| MAD | (Click to select) is more sensitive to large forecast errors. is easy to calculate. is easy to understand. | |
| MSE | (Click to select) is easy to understand. is more sensitive to large forecast errors. is easy to calculate. | |
| MAPE | (Click to select) is easy to understand. is more sensitive to large forecast errors. is easy to calculate. | |
Step by Step Solution
There are 3 Steps involved in it

Get step-by-step solutions from verified subject matter experts