

Question: Two different simple random samples are drawn from two different populations. The first sample consists of 20 people with 9 having a common attribute. The
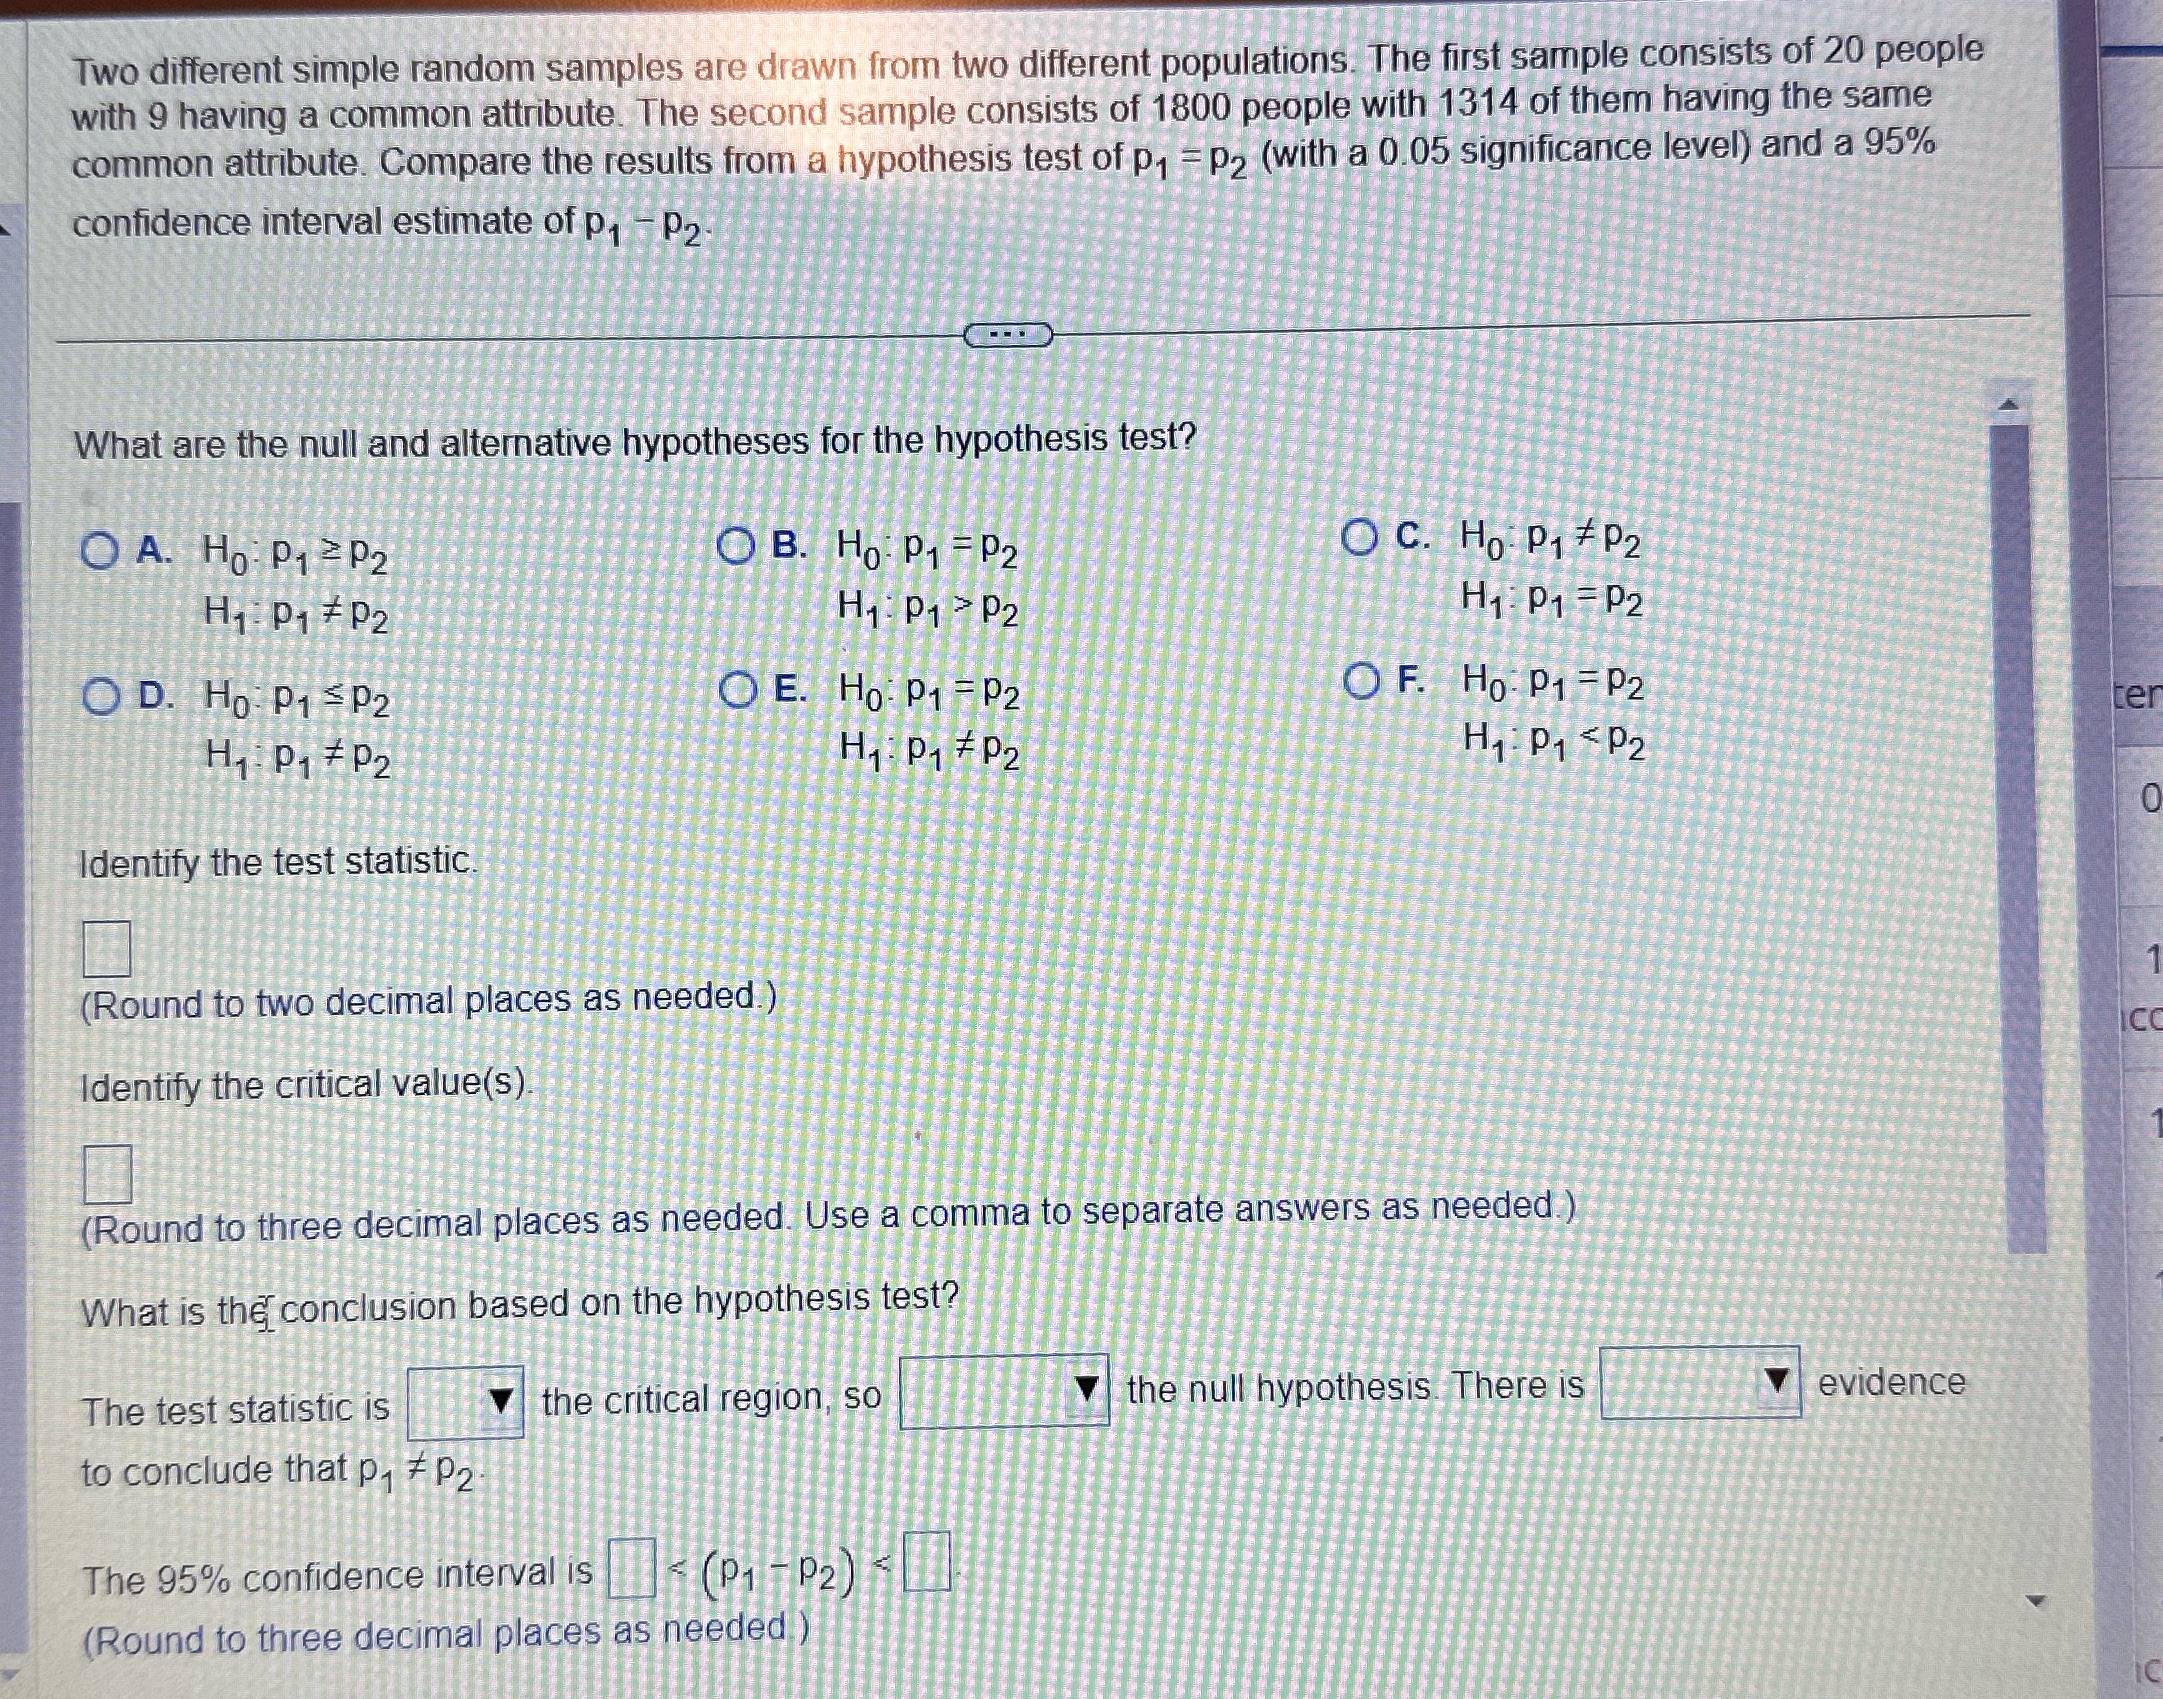
Two different simple random samples are drawn from two different populations. The first sample consists of 20 people with 9 having a common attribute. The second sample consists of 1800 people with 1314 of them having the same common attribute. Compare the results from a hypothesis test of p, =P2 (with a 0.05 significance level) and a 95% confidence interval estimate of P, - P2- What are the null and alternative hypotheses for the hypothesis test? O A. Ho P1 = P2 OB. Ho- P1 = P2 OC. Ho P1# P2 H1 P1 # P2 H1 P1 = P2 H1 P1 = P2 OD. HO P1 = P2 OE. Ho- P1 =P2 OF. Ho P1 = P2 te H1 P1 # P2 H1: P1 # P 2 H1 P1 = P2 Identify the test statistic. Round to two decimal places as needed.) Identify the critical value(s). (Round to three decimal places as needed. Use a comma to separate answers as needed.) What is the conclusion based on the hypothesis test? The test statistic is the critical region, so the null hypothesis. There is evidence to conclude that p1 7 P2: The 95% confidence interval is - (P1 - P2) ; (Round to three decimal places as needed )
Step by Step Solution
There are 3 Steps involved in it

Get step-by-step solutions from verified subject matter experts