

Question: Two questions about statistics Use the fitted line plots below to answer Questions 4 and 5. If you prefer you can download this pdf of
Two questions about statistics
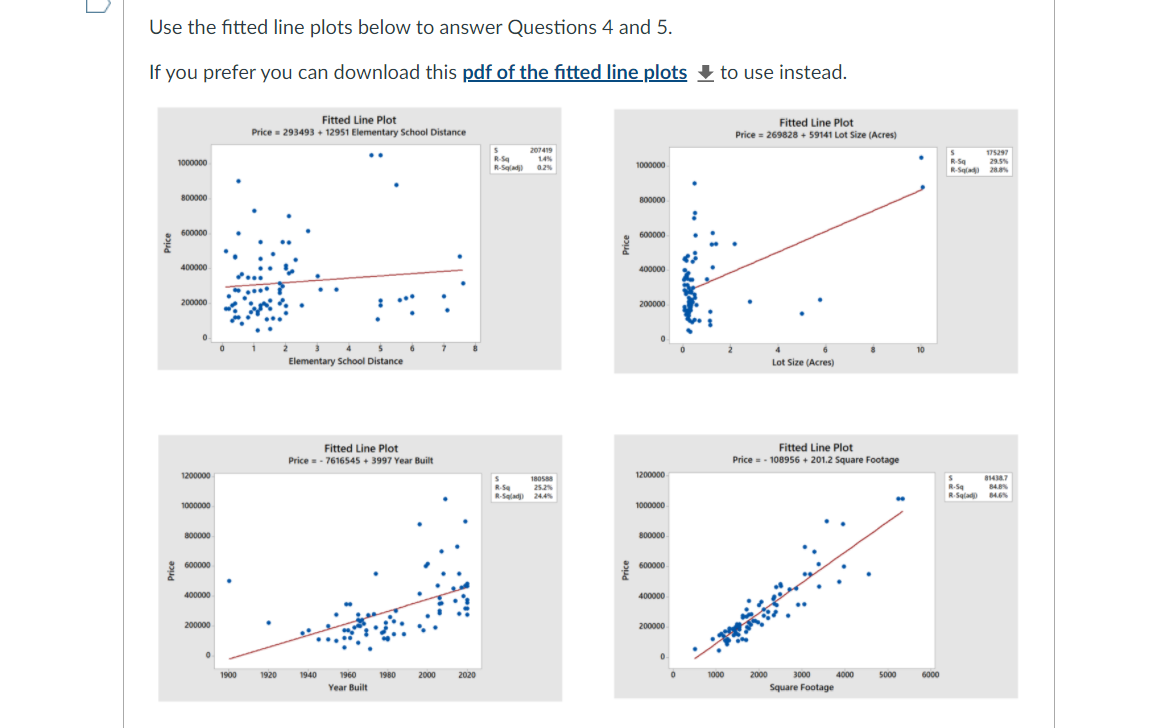
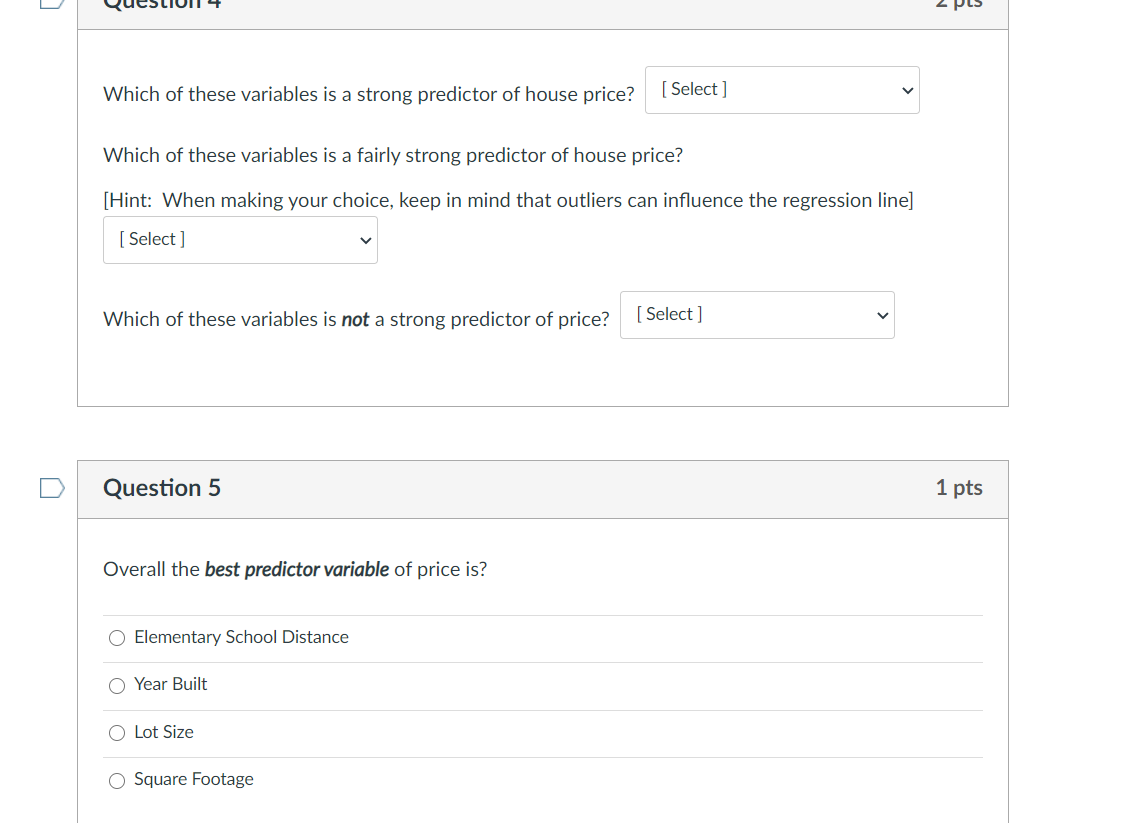
Use the fitted line plots below to answer Questions 4 and 5. If you prefer you can download this pdf of the fitted line plots _ to use instead. Fitted Line Plot Price = 293493 + 12951 Elementary School Distance Fitted Line Plot Price = 269828 + 59141 Lot Size (Acres) 207419 175291 1009000 1000000 R-Sq B-Squad price Price 400080 400000 200000 200000 Elementary School Distance Lot Size (Acres) Fitted Line Plot Fitted Line Plot Price = - 7616545 + 3997 Year Built Price = - 108956 + 201.2 Square Footage 120000 180588 1200000 R.5q 81434.7 252% R.Sqlan BABS 1000000 000000 800000 800000 price 600000 600000 400000 400000 20000 200000 1900 1920 1940 1960 1980 2000 2020 1000 2000 3000 4000 5000 6000 Year Built Square FootageWhich of these variables is a strong predictor of house price? [ Select ] Which of these variables is a fairly strong predictor of house price? [Hint: When making your choice, keep in mind that outliers can influence the regression line] [ Select ] Which of these variables is not a strong predictor of price? [ Select ] v D Question 5 1 pts Overall the best predictor variable of price is? O Elementary School Distance O Year Built O Lot Size O Square Footage
Step by Step Solution
There are 3 Steps involved in it

Get step-by-step solutions from verified subject matter experts