

Question: Two-Sample T Tests for Price by Location Location N Mean SD SE 25 2952.0 1327.1 265. 42 25 1514.5 364. 40 72.879 Difference 1437.5 973.
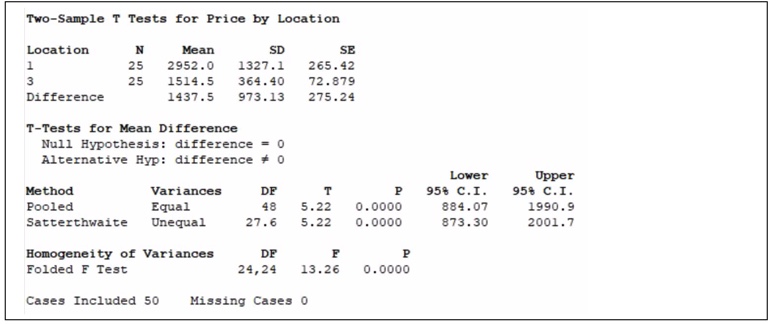
Two-Sample T Tests for Price by Location Location N Mean SD SE 25 2952.0 1327.1 265. 42 25 1514.5 364. 40 72.879 Difference 1437.5 973. 13 275.24 T-Tests for Mean Difference Null Hypothesis: difference = 0 Alternative Hyp: difference * 0 Lower Upper Method Variances DF T P 95% C.I. 95% C.I. Pooled Equal 48 5. 22 0. 0000 884.07 1990.9 Satterthwaite Unequal 27.6 5.22 0. 0000 873. 30 2001.7 Homogeneity of Variances DF F P Folded F Test 24, 24 13.26 0. 0000 Cases Included 50 Missing Cases 0
Step by Step Solution
There are 3 Steps involved in it
1 Expert Approved Answer
Step: 1 Unlock

Question Has Been Solved by an Expert!
Get step-by-step solutions from verified subject matter experts
Step: 2 Unlock
Step: 3 Unlock