

Question: Two-Way (Bivariate) Percentage Tables Data Analysis Assignment In the following table, the variable voting intention is classified into three categories and the variable age is
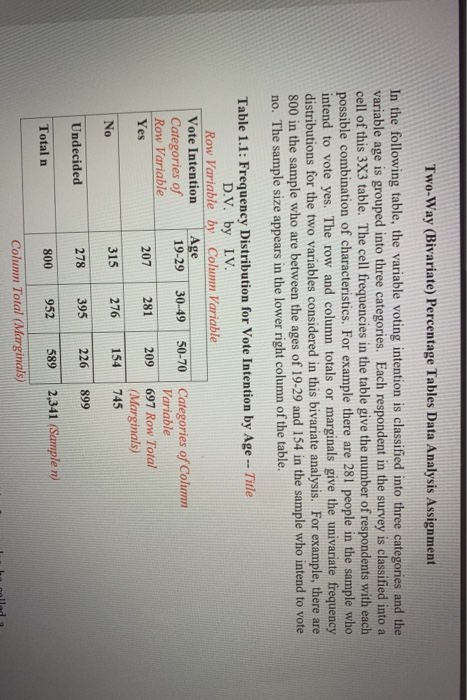
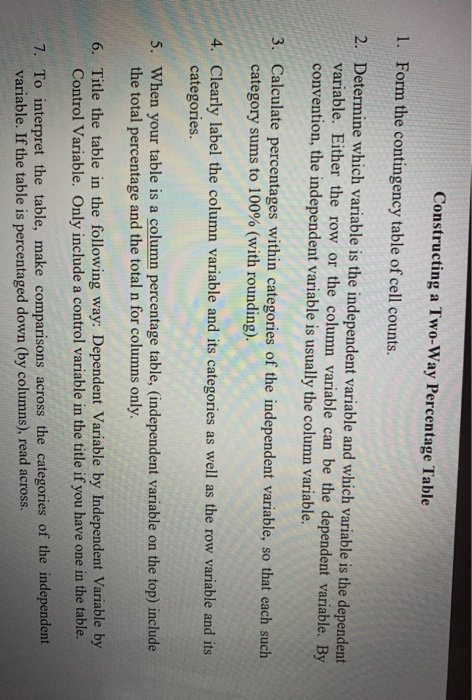

Two-Way (Bivariate) Percentage Tables Data Analysis Assignment In the following table, the variable voting intention is classified into three categories and the variable age is grouped into three categories. Each respondent in the survey is classified into a cell of this 3X3 table. The cell frequencies in the table give the number of respondents with each possible combination of characteristics. For example there are 281 people in the sample who intend to vote yes. The row and column totals or marginals give the univariate frequency distributions for the two variables considered in this bivariate analysis. For example, there are 800 in the sample who are between the ages of 19-29 and 154 in the sample who intend to vote no. The sample size appears in the lower right column of the table. Table 1.1: Frequency Distribution for Vote Intention by Age -- Title D.V. by I.V. Row Variable by Column Variable Vote Intention Age Categories of 19-29 30-49 50-70 Categories of Column Row Variable Variable Yes 207 281 209 697 Row Total (Marginals) No 315 276 154 745 278 226 395 Undecided 899 800 589 952 Total n 2,341 (Sample ) Column Total (Marginals) For example, we might be interested in answering the question: Does age influence the decision to vote? In this case age is the independent variable and intention to vote is the dependent variable. Our interest in assessing the influence of age on the intention to vote suggests a comparison of intent to vote distributed across the categories of age. This comparison is made difficult when we only have the frequencies within each cell of the contingency table. For example, more of the 30-49 respondents plan to vote yes than in the other two groups (281 vs. 207 and 209) but there are also more 30-49 year old people in total than in the other groups (952 vs. 800 and 589). This problem can be addressed by calculating the percentage distribution across intending to vote categories within each age category. The total in each age category is standardized to 100% facilitating comparisons among the age groups. To construct a two-way percentage table to following steps should be used: year old Constructing a Two-Way Percentage Table 1. Form the contingency table of cell counts. 2. Determine which variable is the independent variable and which variable is the dependent variable. Either the row or the column variable can be the dependent variable. By convention, the independent variable is usually the column variable. 3. Calculate percentages within categories of the independent variable, so that each such category sums to 100% (with rounding). 4. Clearly label the column variable and its categories as well as the row variable and its categories 5. When your table is a column percentage table, (independent variable on the top) include the total percentage and the total n for columns only. 6. Title the table in the following way: Dependent Variable by Independent Variable by Control Variable. Only include a control variable in the title if you have one in the table. 7. To interpret the table, make comparisons across the categories of the independent variable. If the table is percentaged down (by columns), read across. Please construct a 2x2 bivariate percentage table ***using the (7) steps listed in 3rd picture "constructing a two way percentage table" *** Basically you just follow the 7 steps given for the example above the actual question. You create the bivariate contingency table from that and then you just write a few sentences about the data collected, and if there is a relationship between the variables
Step by Step Solution
There are 3 Steps involved in it

Get step-by-step solutions from verified subject matter experts