

Question: T(x) = 43.5 - 18.4x + 8.57x2 - 0.996x3 + 0.0338x4 where T represents the temperature (in degrees Fahrenheit), x = 1 represents the middle
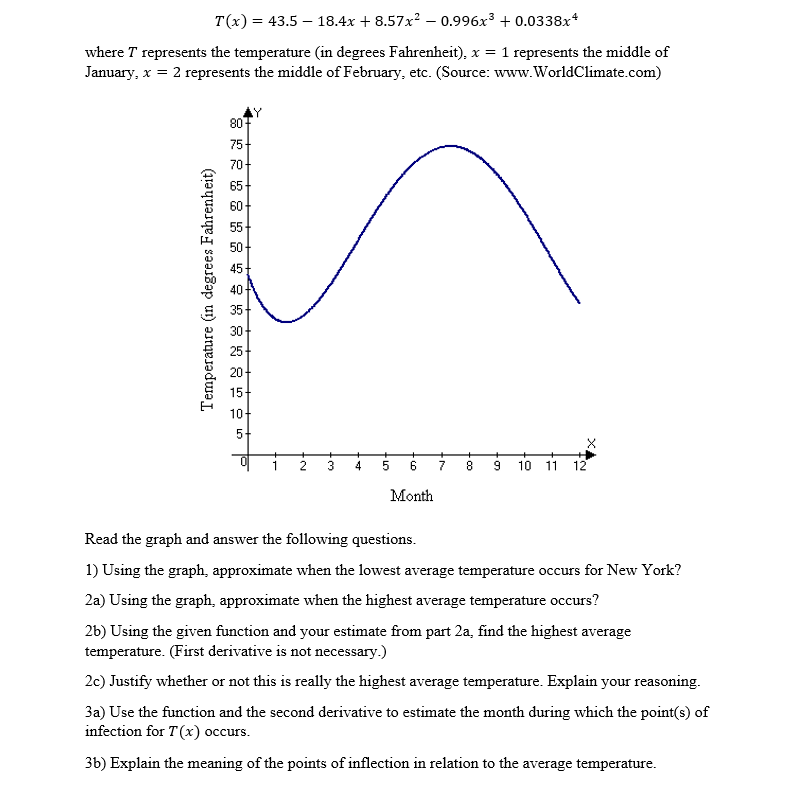
T(x) = 43.5 - 18.4x + 8.57x2 - 0.996x3 + 0.0338x4 where T represents the temperature (in degrees Fahrenheit), x = 1 represents the middle of January, x = 2 represents the middle of February, etc. (Source: www.WorldClimate.com) AY Temperature (in degrees Fahrenheit) X 2 w+ 4 5 6 7 9 10 11 12 Month Read the graph and answer the following questions. 1) Using the graph, approximate when the lowest average temperature occurs for New York? 2a) Using the graph, approximate when the highest average temperature occurs? 2b) Using the given function and your estimate from part 2a, find the highest average temperature. (First derivative is not necessary.) 2c) Justify whether or not this is really the highest average temperature. Explain your reasoning. 3a) Use the function and the second derivative to estimate the month during which the point(s) of infection for T(x) occurs. 3b) Explain the meaning of the points of inflection in relation to the average temperature
Step by Step Solution
There are 3 Steps involved in it

Get step-by-step solutions from verified subject matter experts