

Question: (Ty) Interpreting Graphs 1. The graphs below describe the motion of the surgical tool across the microsurgery track in terms of positions and times.
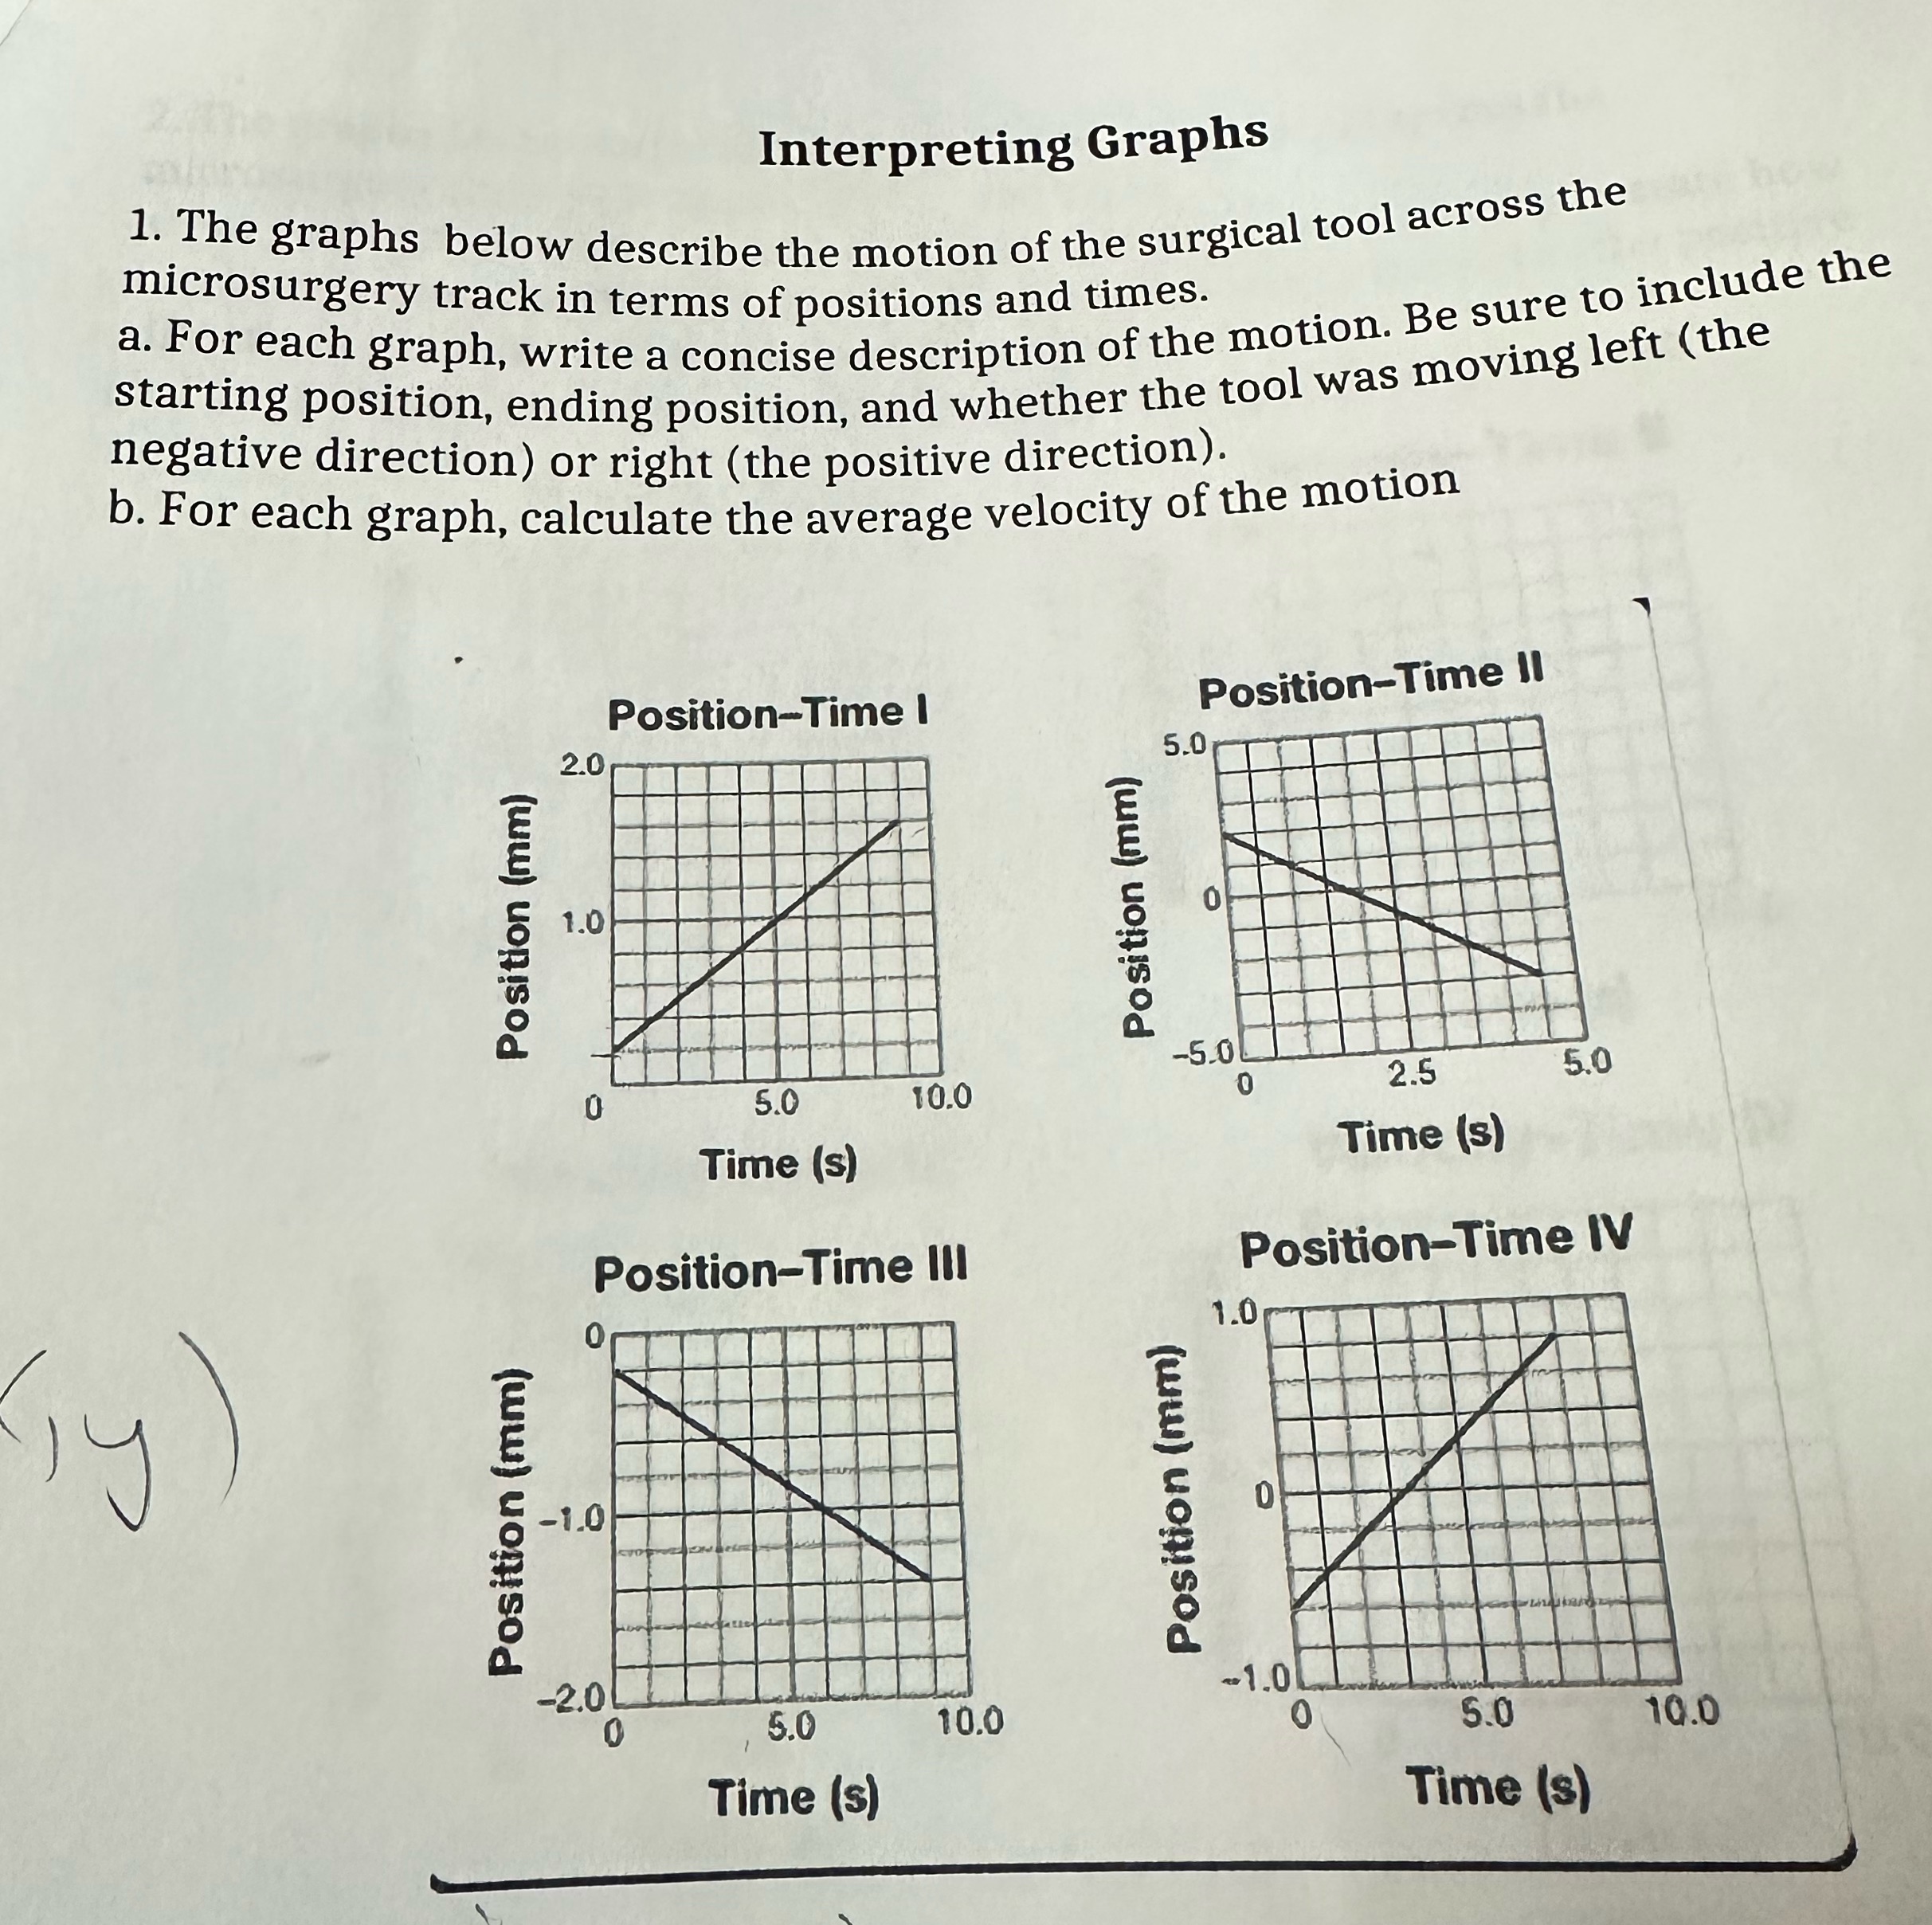
(Ty) Interpreting Graphs 1. The graphs below describe the motion of the surgical tool across the microsurgery track in terms of positions and times. a. For each graph, write a concise description of the motion. Be sure to include the starting position, ending position, and whether the tool was moving left (the negative direction) or right (the positive direction). b. For each graph, calculate the average velocity of the motion Position (mm) -1.0 -2.0 0 Position (mm) 1.0 2.0 Position-Time I 0 0 5.0 Time (s) 10.0 Position-Time III Position (mm) Position (mm) 5.0 Position-Time II -5.0 0 2.5 Time (s) 5.0 Position-Time IV 1.0 0 5.0 10.0 -1.0 0 5.0 10.0 Time (s) Time (s)
Step by Step Solution
There are 3 Steps involved in it

Get step-by-step solutions from verified subject matter experts