

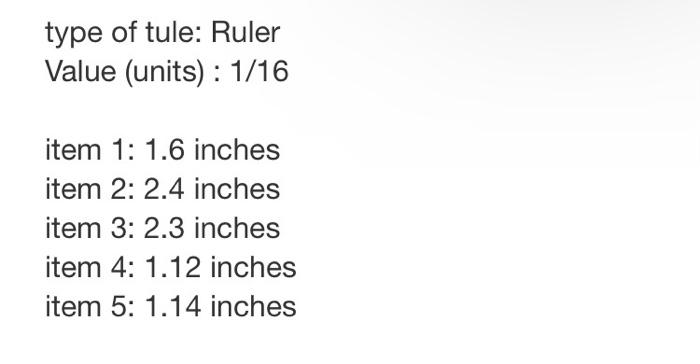
type of tule: Ruler Value (units): 1/16 item 1: 1.6 inches item 2: 2.4 inches item...
Fantastic news! We've Found the answer you've been seeking!
Question:
Transcribed Image Text:
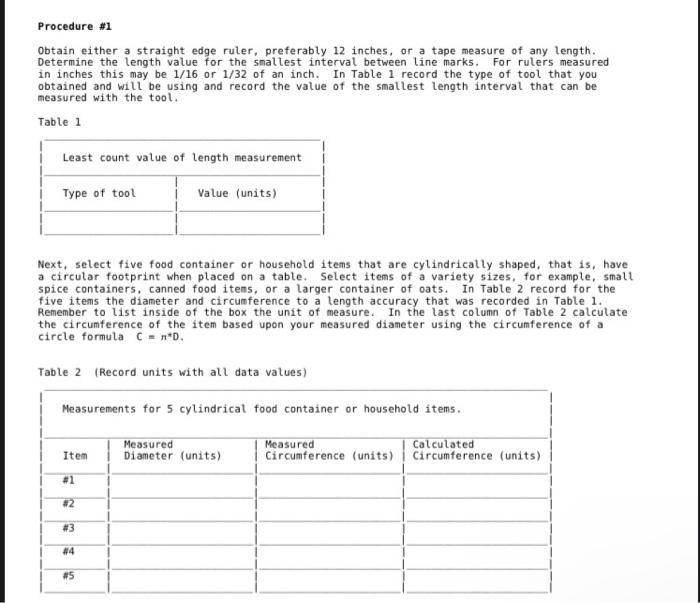
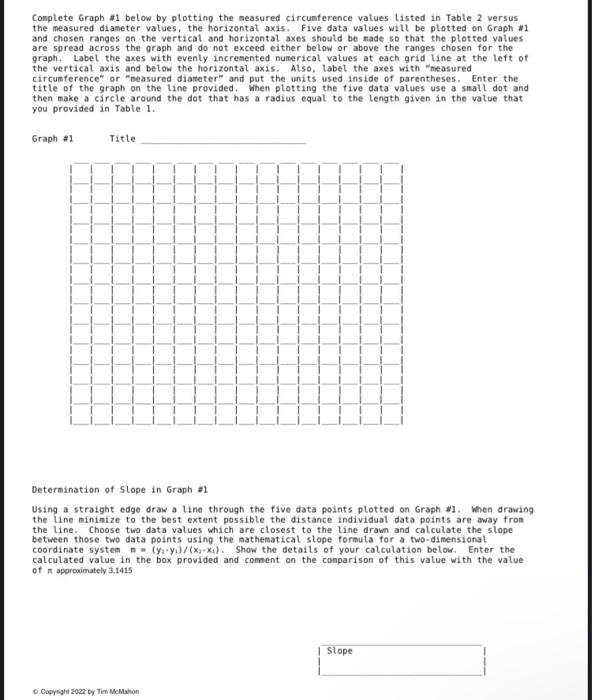
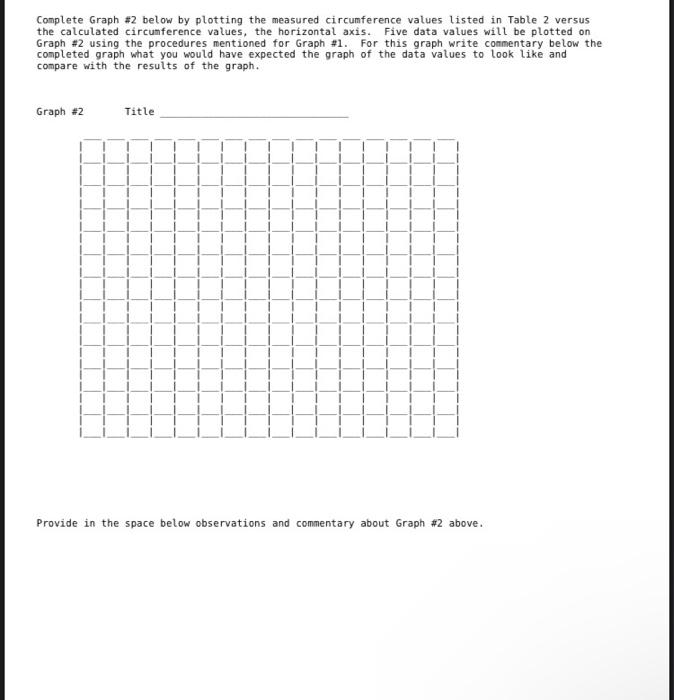
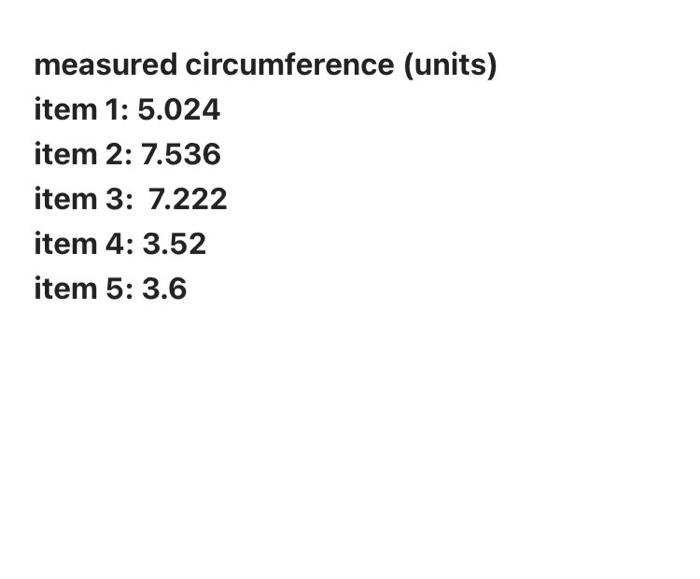
type of tule: Ruler Value (units): 1/16 item 1: 1.6 inches item 2: 2.4 inches item 3: 2.3 inches item 4: 1.12 inches item 5: 1.14 inches Procedure #1 Obtain either a straight edge ruler, preferably 12 inches, or a tape measure of any length. Determine the length value for the smallest interval between line marks. For rulers measured in inches this may be 1/16 or 1/32 of an inch. In Table 1 record the type of tool that you obtained and will be using and record the value of the smallest length interval that can be measured with the tool. Table 1 Least count value of length measurement Type of tool Next, select five food container or household items that are cylindrically shaped, that is, have a circular footprint when placed on a table. Select items of a variety sizes, for example, small spice containers, canned food items, or a larger container of oats. In Table 2 record for the five items the diameter and circumference to a length accuracy that was recorded in Table 1. Remember to list inside of the box the unit of measure. In the last column of Table 2 calculate the circumference of the item based upon your measured diameter using the circumference of a circle formula C = n*D. Table 2 (Record units with all data values) Value (units) Measurements for 5 cylindrical food container or household items. Item #1 #2 #3 #4 #5 Measured Diameter (units) Measured Calculated Circumference (units) Circumference (units) Complete Graph #1 below by plotting the measured circumference values listed in Table 2 versus the measured diameter values, the horizontal axis. Five data values will be plotted on Graph #1 and chosen ranges on the vertical and horizontal axes should be made so that the plotted values are spread across the graph and do not exceed either below or above the ranges chosen for the graph. Label the axes with evenly incremented numerical values at each grid line at the left of the vertical axis and below the horizontal axis. Also, label the axes with "measured circumference" or "measured diameter" and put the units used inside of parentheses. Enter the title of the graph on the line provided. When plotting the five data values use a small dot and then make a circle around the dot that has a radius equal to the length given in the value that you provided in Table 1.. Graph #1 Title Determination of Slope in Graph #1 Using a straight edge draw a line through the five data points plotted on Graph #1. When drawing the line minimize to the best extent possible the distance individual data points are away from the line. Choose two data values which are closest to the line drawn and calculate the slope between those two data points using the mathematical slope formula for a two-dimensional coordinate system n= (y2-yi)/(x-x₁). Show the details of your calculation below. Enter the calculated value in the box provided and comment on the comparison of this value with the value of n approximately 3.1415 © Copyright 2022 by Tim McMahon | Slope Complete Graph #2 below by plotting the measured circumference values listed in Table 2 versus the calculated circumference values, the horizontal axis. Five data values will be plotted on Graph #2 using the procedures mentioned for Graph #1. For this graph write commentary below the completed graph what you would have expected the graph of the data values to look like and compare with the results of the graph. Graph #2 Title Provide in the space below observations and commentary about Graph #2 above. measured circumference (units) item 1: 5.024 item 2: 7.536 item 3: 7.222 item 4: 3.52 item 5: 3.6 type of tule: Ruler Value (units): 1/16 item 1: 1.6 inches item 2: 2.4 inches item 3: 2.3 inches item 4: 1.12 inches item 5: 1.14 inches Procedure #1 Obtain either a straight edge ruler, preferably 12 inches, or a tape measure of any length. Determine the length value for the smallest interval between line marks. For rulers measured in inches this may be 1/16 or 1/32 of an inch. In Table 1 record the type of tool that you obtained and will be using and record the value of the smallest length interval that can be measured with the tool. Table 1 Least count value of length measurement Type of tool Next, select five food container or household items that are cylindrically shaped, that is, have a circular footprint when placed on a table. Select items of a variety sizes, for example, small spice containers, canned food items, or a larger container of oats. In Table 2 record for the five items the diameter and circumference to a length accuracy that was recorded in Table 1. Remember to list inside of the box the unit of measure. In the last column of Table 2 calculate the circumference of the item based upon your measured diameter using the circumference of a circle formula C = n*D. Table 2 (Record units with all data values) Value (units) Measurements for 5 cylindrical food container or household items. Item #1 #2 #3 #4 #5 Measured Diameter (units) Measured Calculated Circumference (units) Circumference (units) Complete Graph #1 below by plotting the measured circumference values listed in Table 2 versus the measured diameter values, the horizontal axis. Five data values will be plotted on Graph #1 and chosen ranges on the vertical and horizontal axes should be made so that the plotted values are spread across the graph and do not exceed either below or above the ranges chosen for the graph. Label the axes with evenly incremented numerical values at each grid line at the left of the vertical axis and below the horizontal axis. Also, label the axes with "measured circumference" or "measured diameter" and put the units used inside of parentheses. Enter the title of the graph on the line provided. When plotting the five data values use a small dot and then make a circle around the dot that has a radius equal to the length given in the value that you provided in Table 1.. Graph #1 Title Determination of Slope in Graph #1 Using a straight edge draw a line through the five data points plotted on Graph #1. When drawing the line minimize to the best extent possible the distance individual data points are away from the line. Choose two data values which are closest to the line drawn and calculate the slope between those two data points using the mathematical slope formula for a two-dimensional coordinate system n= (y2-yi)/(x-x₁). Show the details of your calculation below. Enter the calculated value in the box provided and comment on the comparison of this value with the value of n approximately 3.1415 © Copyright 2022 by Tim McMahon | Slope Complete Graph #2 below by plotting the measured circumference values listed in Table 2 versus the calculated circumference values, the horizontal axis. Five data values will be plotted on Graph #2 using the procedures mentioned for Graph #1. For this graph write commentary below the completed graph what you would have expected the graph of the data values to look like and compare with the results of the graph. Graph #2 Title Provide in the space below observations and commentary about Graph #2 above. measured circumference (units) item 1: 5.024 item 2: 7.536 item 3: 7.222 item 4: 3.52 item 5: 3.6
Expert Answer:
Answer rating: 100% (QA)
Option D is correct A synchronous motor is connected to an infin... View the full answer

Related Book For 

Posted Date:
Students also viewed these physics questions
-
Measure that ball: Each of 16 students measured the circumference of a tennis ball by two different methods: A: Estimate the circumference by eye. B: Measure the circumference by rolling the ball...
-
A cylindrically shaped piece of collagen (a substance found in the body in connective tissue) is being stretched by a force that increases from 0 to 3.0 Ã 10-2 N. The length and radius of the...
-
An aluminum alloy roller with diameter 1 in and length 2 in rolls on the inside of a cast-iron ring having an inside radius of 4 in, which is 2 in thick. Find the maximum contact force F that can be...
-
Formulate a plausible mechanism for the following reaction. The product is a precursor of mediquox (shown in the margin), an agent used to treat respiratory infections in chickens (no, we are not...
-
The table below shows the stock price, earnings per share, and dividends per share for three companies as of a recent date: a. Determine the price-earnings ratio and dividend yield for the three...
-
Should promises made in an employee handbook legally bind an employer?
-
1.10 Aidan, the MNE. At what point in the globalization process did Aidan become a multinational enter- prise (MNE)?
-
The Budgetary Comparison Schedule for the City of Salem appears in Illustration 216. Assume the general and subsidiary ledgers for the General Fund were lost after a water pipe burst. You are charged...
-
I am having difficulty understanding the following question, I kindly seek your explanation. B. List several rules to be observed in the preparation of working papers that reflect current...
-
You, CPA, work as a consultant on various engagements. Your client, Over The Edge Ltd. (OTE), has grown from a small custom snowboard manufacturer servicing the local market to a multinational...
-
Saul Goodman after years of struggling, founded a law firm wherein he is the sole practicing attorney. Through ten years of hustling and hard work, Saul Goodman has a loyal clientele, servicing a...
-
On January 1 , 2 0 2 4 , Wright Transport sold four school buses to the Elmira School District. In exchange for the buses, Wright received a note requiring payment of $ 5 2 8 , 0 0 0 by Elmira on...
-
The records for Kalman Ltd . show the following data for calendar 2 0 2 3 : 1 . Gross profit on instalment sales recorded on the books was $ 1 0 0 , 0 0 0 . Gross profit from collections of...
-
At May 3 1 , 2 0 2 2 , the accounts of Blossom Manufacturing Company show the following. May 1 inventories - finished go ds $ 1 5 , 6 2 4 , work in process $ 1 8 , 2 2 8 , and raw materials $ 1 0 , 1...
-
The sales of a company grow from $450 to $730 over 8 years. What is the percentage growth per annum, r?
-
John Reardon purchased 100 shares of Tomco Corporation in December 2019, at a total cost of $1,782. He held the shares for 15 months and then sold them, netting $2,535. During the period he held the...
-
Why are mental health problems more present among the poor than among those who are affluent? Provide examples of stressors that make poor people vulnerable to mental health problems. What kind of...
-
Determine the center and radius of each circle. Sketch each circle. 4x 2 + 4y 2 9 = 16y
-
The table below displays running times and ages of individuals who participated in a 5-mile run. Calculate a value of r, using the computation formula. Time (in minutes)...
-
You are given the following information for the data displayed in the scatterplot in Exercise 7. Least squares prediction equation: Y' = .70(X) +11.80 SS y = 826.23 SS y|x = 68.04 Using this...
-
Select the approximate p-value for each of the following test results: a. p > .05 b. p < .05 c. p < .01 d. p < .001 1. One-tailed test, lower tail critical; df = 18; t = -1.857 2. Two-tailed test; df...
-
For each of the flows in Problems 1 and 2, for which an irregular structured grid has been found necessary and possible, suggest a coordinate transformation.
-
Consider the primitive LES and RANS models, in which the eddy viscosity formulas (11.32) and (11.77) are applied with constant eddy viscosity \(\mu_{t}\). What is the drawback of these models? Should...
-
If your course involves exercises with CFD software, study the documentation to determine whether the LES option is implemented. Which closure models are used? What approach is taken to the near-wall...

Study smarter with the SolutionInn App