

You are given the following information for the data displayed in the scatterplot in Exercise 7. Least
Question:
Least squares prediction equation: Y' = .70(X) +11.80
SSy = 826.23
SSy|x = 68.04
Using this information, calculate these measures.
a. The SS measure of the actual gain in accuracy due to the least squares predictions
b. The gain in accuracy relative to the original error variability for the repetitive prediction of the arm circumference mean
c. r2
d. r
Data from exercise 7
In Exercise 5, arm circumference of a sample of females was predicted from waist measurement. In the scatterplot shown below, arm circumference of the same females is predicted from their body mass index (BMI).
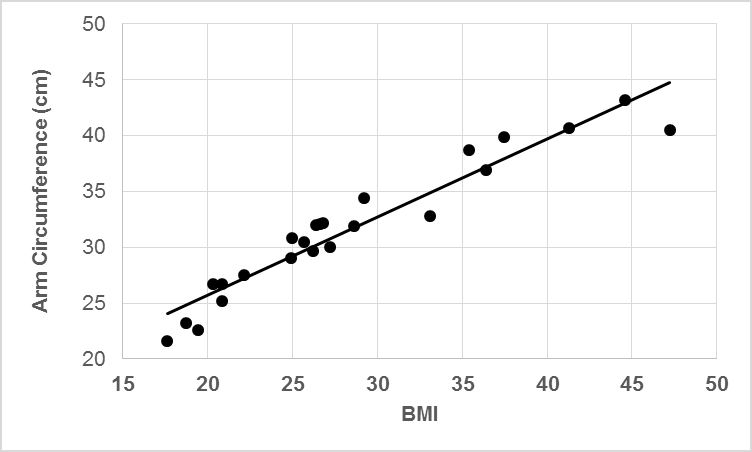
Compare the Exercise 5 and Exercise 7 scatterplots. Which appears to be a better predictor of arm circumference, waist measurement or BMI? Why?
Fantastic news! We've Found the answer you've been seeking!
Step by Step Answer:
a SS y SS yx 82623 6804 758...View the full answer

Answered By
Anoop V
I have five years of experience in teaching and I have National Eligibility in teaching (UGC-NET) .
1+ Reviews
10+ Question Solved
Related Book For 

Question Posted:
